
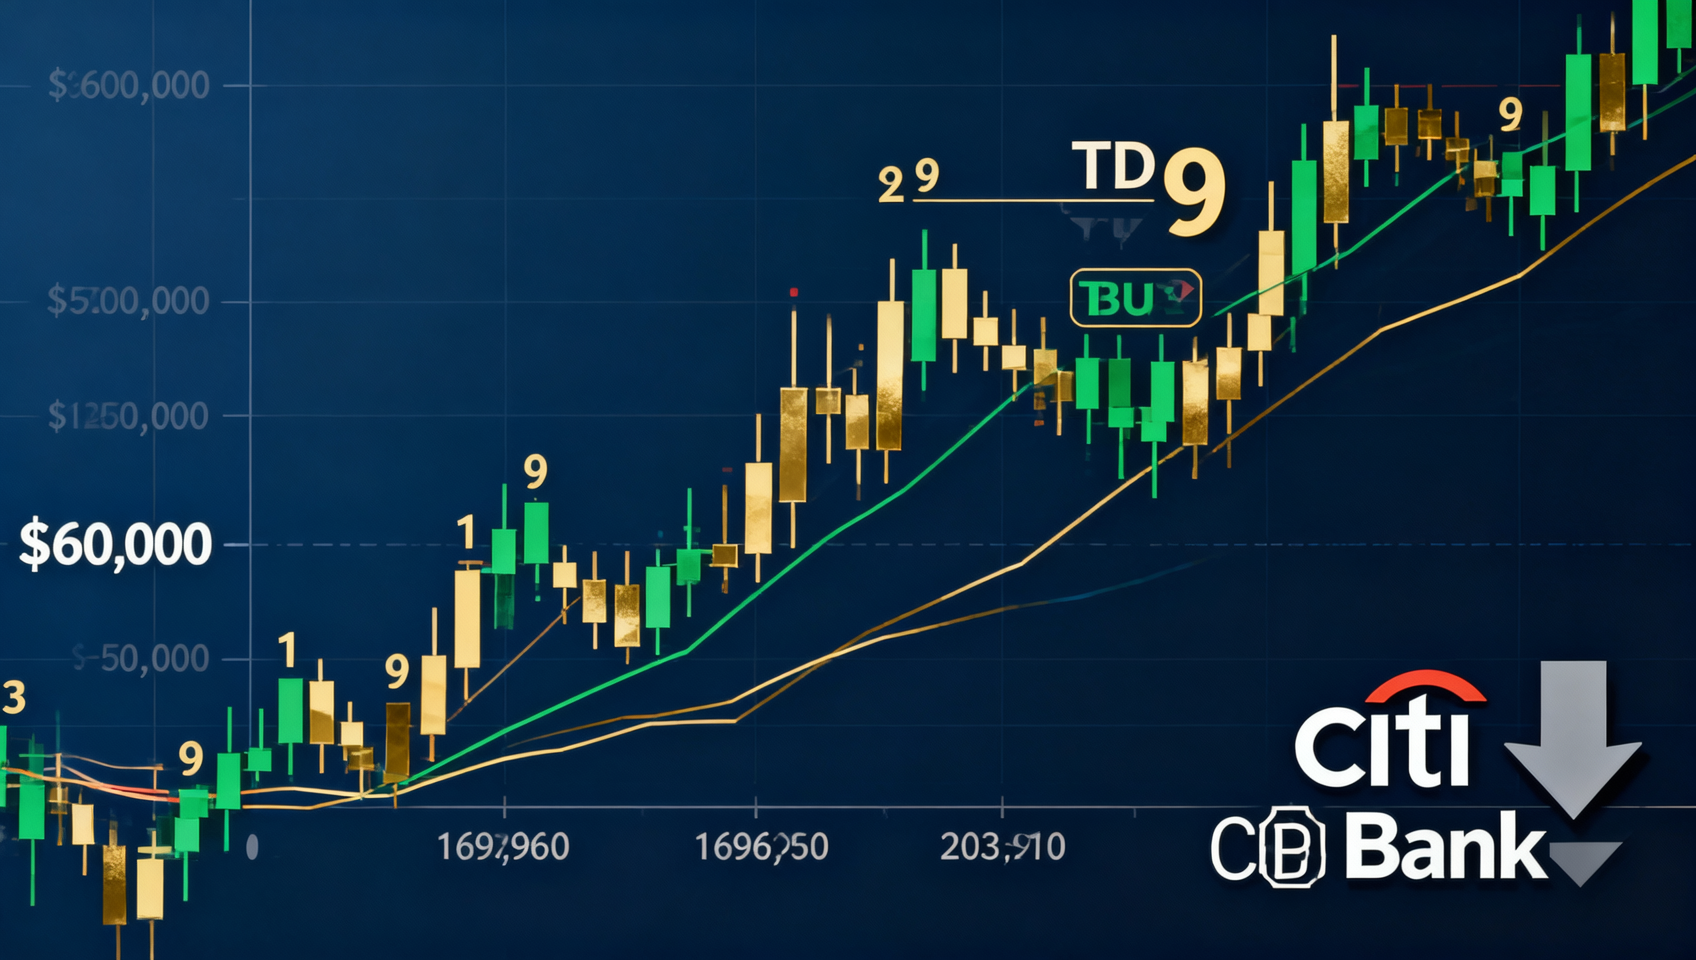
Crypto News Deep Review July 2: BTC Reclaims $60K, Citi Cuts Target to $82K, Rare TD9 Buy Signal
Bitcoin bounces back to $60K after brutal June; Citi slashes 12-month BTC target from $112K to $82K; TD Sequential monthly buy signal across BTC, ETH, XRP, SOL for first time since July 2022.
Today's Headlines
| Event | Key Point |
|---|---|
| 📈 BTC Reclaims $60K | TD Sequential triggers rare monthly buy signal, first since July 2022 |
| 🏦 Citi Slashes BTC Target to $82K | ETF inflow assumption cut from $10B to zero |
| 📊 US NFP Data Today | Key macro catalyst; strong jobs could pressure BTC further |
| 🔴 June ETF Outflows Hit Record $4.5B | 13-day consecutive outflow streak |
| 🇪🇺 MiCA Day 2: Market Adjusts | Binance EU restricted, licensed platforms compete |
1. 📈 BTC Reclaims $60K: Rare Monthly Buy Signal
After June's brutal 18.5% monthly decline (worst since June 2022), Bitcoin bounced back above $60,000. Currently trading in the $58,670-$60,117 range.
TD Sequential Monthly '9' Buy Signal
Analyst Ali Charts flagged a rare event: the TD Sequential indicator printed a monthly '9' buy setup simultaneously across BTC, ETH, XRP, and SOL — the first time since July 2022.
Historical reference: The last monthly TD9 buy signal was in July 2022, which preceded the 2023-2025 bull cycle — though BTC spent ~5 months base-building before the rally began.
Cautious Optimism
Analysts caution the signal doesn't guarantee an immediate bottom. Key levels: $58K must hold; $62,445 (200-week MA) to confirm; $65,600 (50-month EMA) for trend reversal.
2. 🏦 Citi Slashes BTC Target to $82K
On July 1, Citigroup published a research note slashing its 12-month Bitcoin target from $112,000 to $82,000, and Ethereum from $3,175 to $2,240.
| Metric | Previous | Current |
|---|---|---|
| 12m ETF inflow assumption | $10B | $0 (zero) |
| BTC 12m target | $112,000 | $82,000 |
| ETH 12m target | $3,175 | $2,240 |
| BTC bear case | - | $53,000 |
The key shift: Citi now assumes zero net ETF inflows over the next 12 months.
Deep Commentary
The most striking part isn't the target price — it's the assumption change. The narrative of 'ETF-driven institutional inflow tsunami' has been replaced by the reality of $4.5B June outflows.
3. 📊 US NFP Data Today: Key Catalyst
Tonight's US June Nonfarm Payrolls: prior +172K, expected ~170K. Fed pricing 80% probability of September rate hike.
| NFP Data | BTC Reaction |
|---|---|
| Above expectations (>172K) | 📉 Further downside, possible $57K break |
| In line (~170K) | 📊 Range-bound choppiness |
| Below expectations (<160K) | 📈 Relief rally possible |
4. 🔴 June ETF Outflows Deep Dive
- Net outflows: $4.5B (record)
- Consecutive outflow days: 13
- YTD net outflow: $3.3B
- BlackRock IBIT share: ~75% ($3.3B)
The $4.4B Supply Overhang
ETFs sold ~71,600 BTC ($4.2B); corporate treasuries bought ~7,500 BTC; miners added ~13,500 BTC. Net oversupply: ~77,000 BTC ($4.4B).
5. Bottom Signal or Bear Rally?
Bullish Factors
- ✅ TD Sequential buy signal (historically reliable)
- ✅ Extreme Fear (historical buying zone)
- ✅ July seasonality (avg +7.6% over 6 years)
- ✅ >50% of BTC supply at a loss (capitulation signal)
Bearish Factors
- ❌ Persistent ETF outflows
- ❌ Hawkish Fed, likely September rate hike
- ❌ Citi downgrade adds negative sentiment
- ❌ $4.4B supply overhang needs digestion
Bottom line: BTC likely ranges $58K-$62K short-term. The TD9 signal offers technical reversal potential, but needs fundamental confirmation.
6. Market Snapshot
| Metric | Value |
|---|---|
| BTC | $58,670-$60,117 |
| ETH | $1,574 |
| Total Market Cap | ~$2.04T |
| BTC Dominance | 55.2% |
| Fear & Greed | 10-46 (divergent) |
⚠️ Disclaimer: This article is for informational purposes only.
📚 Learning Resource: What is Blockchain? Complete Beginner Guide — Blockchain fundamentals and on-chain data analysis tutorials