
Deep Market Analysis July 1: BTC Breaks Below $59K, Extreme Fear at 16, $58K 'Do or Die' Support
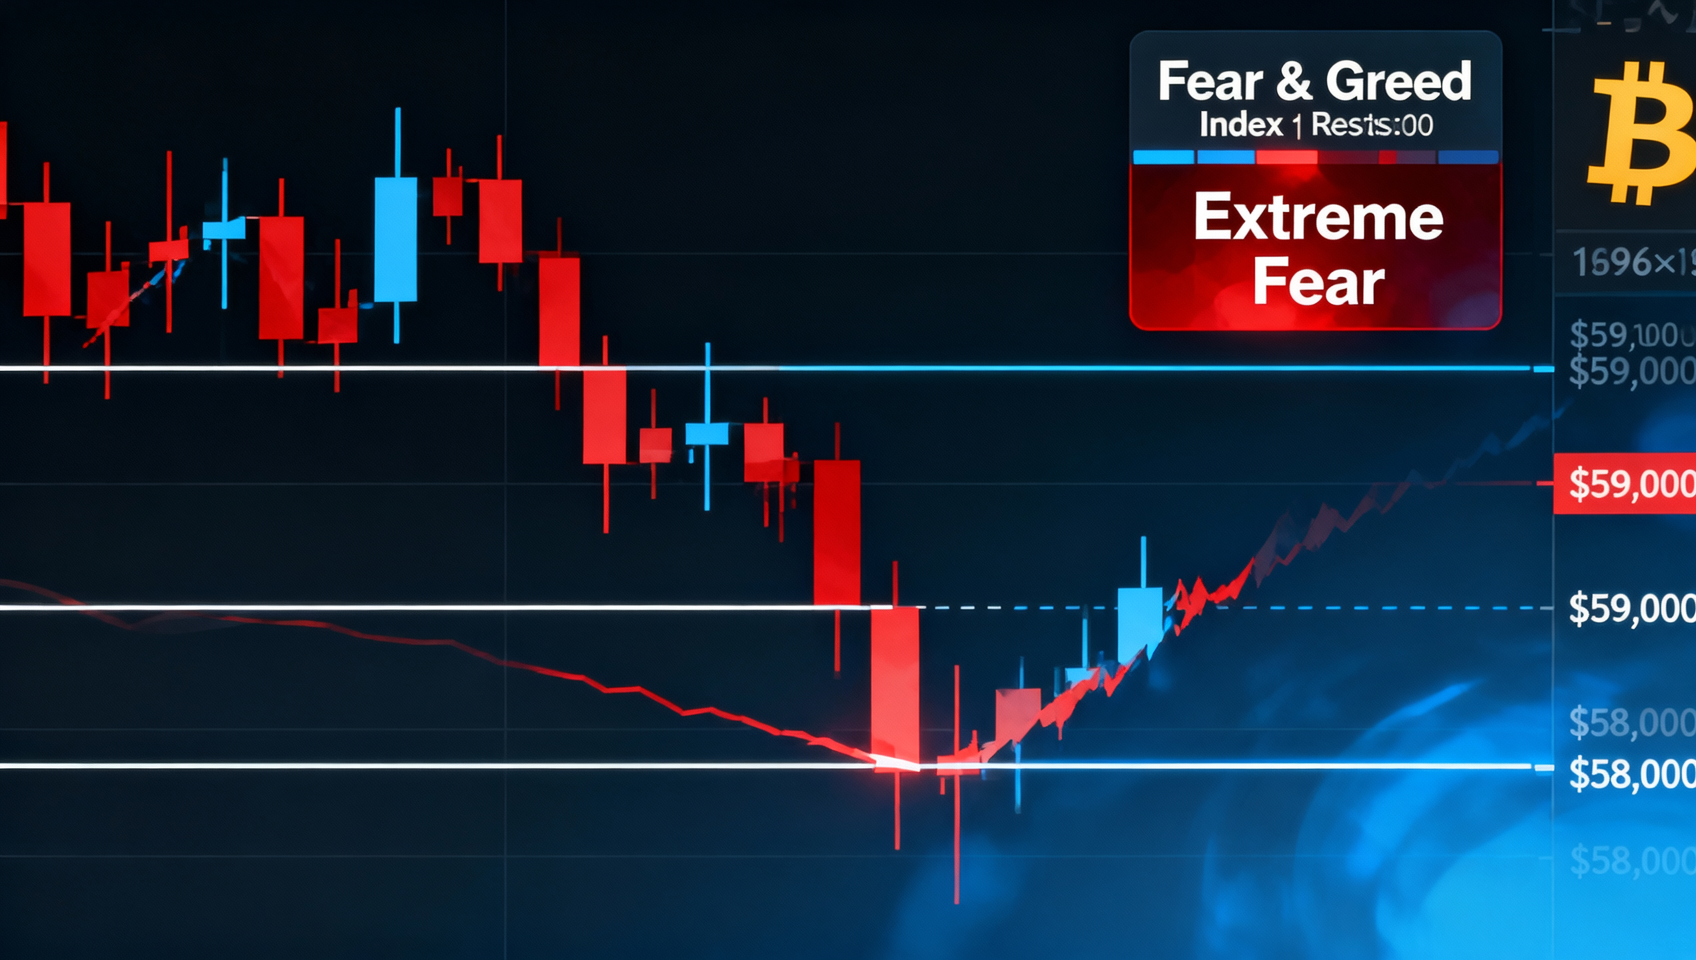
Bitcoin drops below $59K to $58,400-$58,700 range, Fear & Greed Index plunges to 16 (Extreme Fear), total market cap $2.04T. $58K is the last defense line for bulls — a breakdown opens the door to $55K-$50K.
Market Overview
| Metric | Value | 24h Change |
|---|---|---|
| Total Market Cap | $2.04T | -1.2% |
| BTC Price | $58,425-$58,741 | -2.76% |
| ETH Price | $1,560-$1,569 | -2.81% |
| BTC Dominance | 55.7% | +0.3% |
| Fear & Greed Index | 16 (Extreme Fear) | Down from 17 |
| 24h Volume | ~$76.6B (spot) | Declining |
1. Bitcoin Technical Analysis
Current State
BTC extended its decline today, breaking below the $59,000 psychological level for the first time since October 2024, currently trading in the $58,400-$58,700 range. BTC has fallen over 53% from its all-time high of $126,198 (October 2025). H1 2026: -31%.
$58,000: The Last Stand for Bulls
All eyes are on the $58,000-$58,200 support zone:
| Scenario | Est. Probability | Target |
|---|---|---|
| $58K holds, bounce | ~45% | $62,500-$64,000 |
| $58K breaks, correction | ~55% | $55,000-$56,200 |
| Deep bear case | ~10-15% | $48,000-$52,000 |
Key Levels
| Level | Price | Significance |
|---|---|---|
| Resistance 3 | $68,586 | 50-day MA, key reclaim for bulls |
| Resistance 2 | $65,631 | 50-month EMA, trend reversal level |
| Resistance 1 | $62,450-$62,500 | Short-term bounce target |
| Current | $58,400-$58,700 | Battle zone |
| Support 1 (Critical) | $58,000-$58,200 | 'Do or Die' support |
| Support 2 | $55,000-$56,200 | Next target if $58K breaks |
| Support 3 | $48,000-$52,000 | Deep correction floor |
Technical Indicators
- RSI: Near oversold territory, but can show 'bear trap' inside downtrend
- BTC trading below all major EMAs (20, 50, 100, 200-day)
- On-chain data shows first bottom signal (CryptoQuant), but analysts caution more pain ahead
Historical Comparison: Extreme Fear Windows
| Period | Index | BTC Price | Subsequent Move |
|---|---|---|---|
| Oct 2022 | ~18 | ~$20K | +265% over 19 months |
| Mar 2020 (COVID crash) | ~10 | ~$5K | +1,280% over 18 months |
| Feb 6, 2026 | 5 (year low) | ~$68K | Brief bounce, then retracement |
2. Altcoin & Top 10 Analysis
Ethereum (ETH)
ETH at $1,560-$1,569, -2.81% in 24h. ETH/BTC pair relatively stable. ETH ETF outflows only $29.9M — far less than BTC's $4.1B, suggesting less institutional selling pressure.
Top 10 by Market Cap
| Rank | Coin | Price | Market Cap | 24h Change |
|---|---|---|---|---|
| 1 | BTC | $58,425-$58,700 | $1.176T | -2.76% |
| 2 | ETH | $1,560-$1,569 | $189B | -2.81% |
| 3 | USDT | $0.998 | $184.7B | stable |
| 4 | BNB | $544-$548 | $73.9B | -0.3% to -4% |
| 5 | USDC | $0.999 | $73.6B | stable |
| 6 | XRP | ~$1.04 | $64.8B | -1.5% |
| 7 | SOL | $73.30-$73.50 | $42.7B | -2.6% |
| 8 | TRX | ~$0.316 | $30B | -0.8% |
| 9 | HYPE | ~$65.60 | $16.6B | -3.2% |
| 10 | DOGE | ~$0.0708 | $11B | -4.8% |
3. On-Chain Data Analysis
ETF Flows
- June total outflow: $4.06-$4.1B (record)
- Cumulative since mid-May: ~$6.35B
- Institutional behavior: Traditional investors reducing crypto exposure, contrasting with 2024-2025 'buy-the-dip' pattern
- Key signal: BlackRock deposited 7,432 BTC ($446M) to Coinbase Prime on June 29 — often interpreted as preparation for selling
Futures Market
- Open interest: ~$19.92B
- 24h liquidations: ~$120M+ (longs dominant)
- Long funding rate: 0.12% (could turn negative in further decline)
On-Chain Activity
- Exchange net outflows of ~$64.5M — some long-term holders still accumulating
- Overall on-chain activity at recent lows, reflecting broad wait-and-see sentiment
4. Macro Context
Multiple headwinds for crypto today:
- Strong US labor data: JOLTS job openings beat expectations, reducing Fed rate cut odds
- Geopolitical tension: Middle East (US-Iran) strikes adding risk-off sentiment
- Capital rotation: AI/semiconductor stocks continuing to attract capital from BTC and gold ETFs
- Sticky inflation: CPI at 4.2%, Fed rate at 3.5%-3.75%
Market awaits Thursday's NFP report (July 2) for the next directional catalyst.
5. Outlook & Strategy
Short-term (1-2 weeks)
$58K is the 'Normandy beach' for bulls. If it holds and NFP data provides a catalyst, BTC could attempt a relief rally to $62,500-$64,000. A daily close below $58K would trigger technical selling toward $55K-$56,200.
Medium-term (1-3 months)
| Scenario | Probability | Target |
|---|---|---|
| Bearish consolidation | ~55% | $55K-$65K range, bottoming process |
| Deep correction | ~15% | $48K-$52K (70% retrace from $69K) |
| Reversal | ~30% | $58K double bottom, seasonal strength to $68K+ |
Seasonal note: BTC has posted +27% to +72% returns in July-August for the past 6 years. If this pattern holds, July could be a 'buying opportunity amidst extreme fear.'
| Signal | Bullish | Bearish |
|---|---|---|
| $58K support | ✅ Holds = double bottom | ❌ Daily close below |
| NFP data | Weak = rate cut hopes | Strong = hawkish Fed |
| ETF flows | Turn to net inflow | Continued outflow |
| Fear & Greed | Extreme Fear (historical buy) | Can get worse |
⚠️ Risk Disclaimer: This analysis is for informational purposes only.
Getting Started: Binance | OKX
📚 Learning Resource: What is Blockchain? Complete Beginner Guide — Blockchain fundamentals and on-chain data analysis tutorials — Blockchain basics and on-chain data analysis tutorials