
Deep Market Analysis July 10: BTC Bounces to $63K Consolidating Ahead of CPI, ETF Inflow Reversal Ends 10-Day Outflow Streak, Whales Accumulate 270K+ BTC in $60K-$63K Range, 200-Week MA Under Reconfirmation
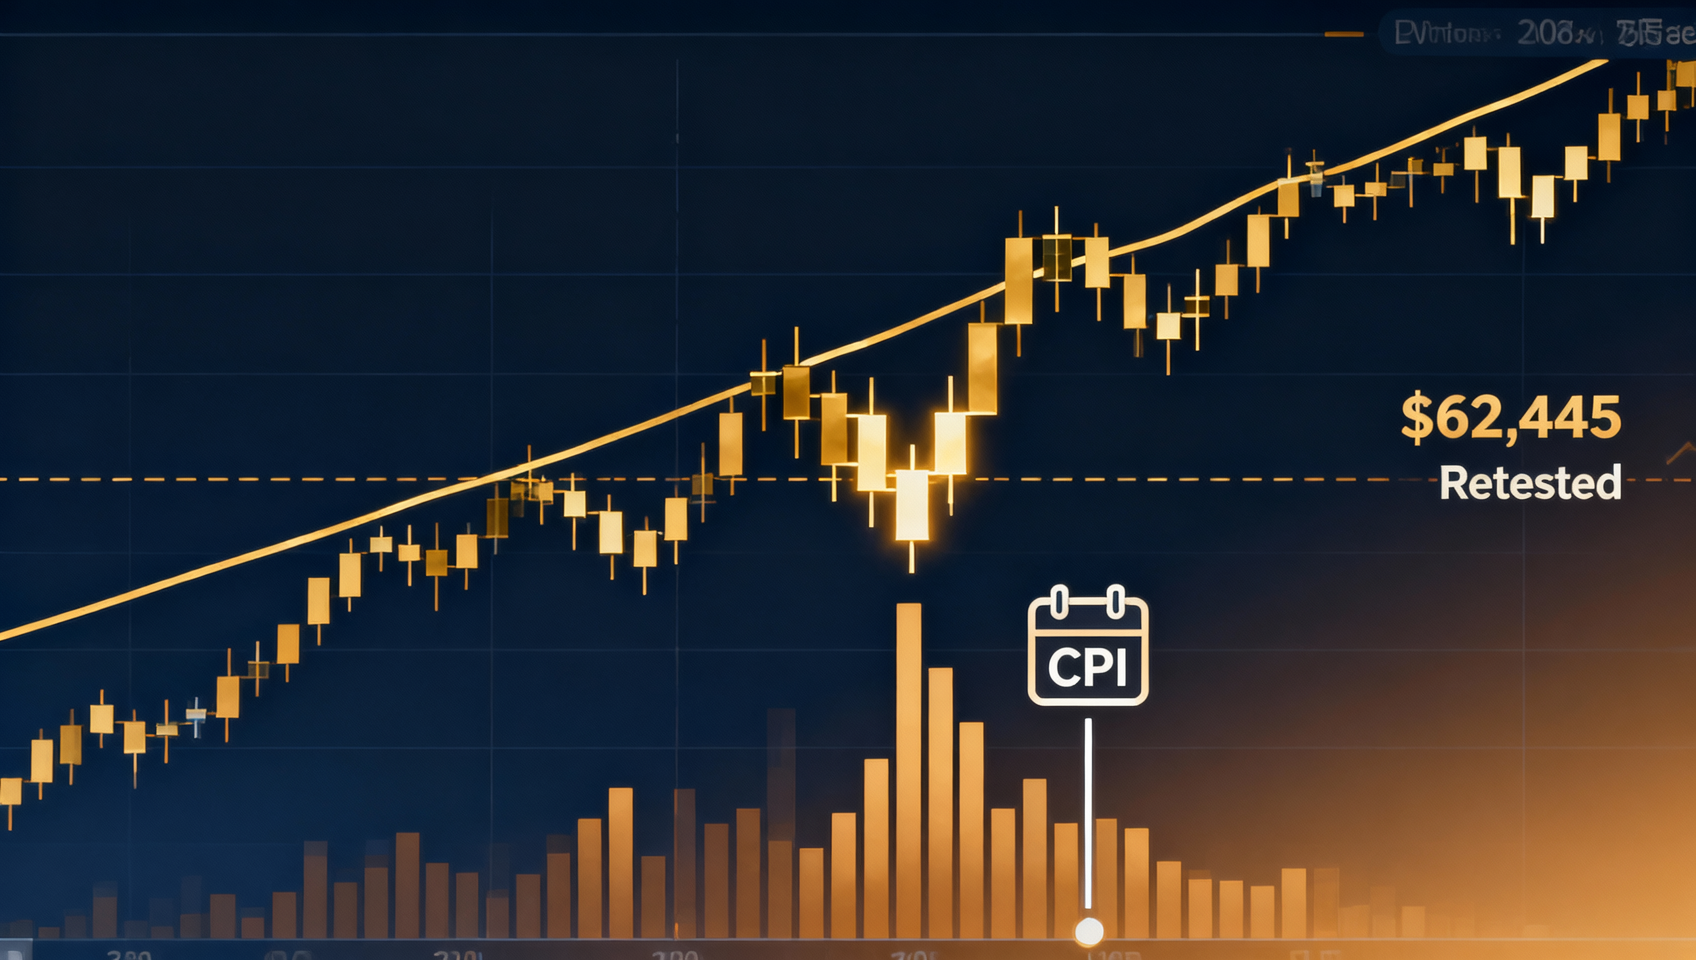
Bitcoin bounces from $61.4K to $63K (+1.5%), consolidating on low volume ahead of CPI. BTC ETFs break 10-day outflow streak with $143M+ inflows; BlackRock IBIT leads with $209M. The 200-week MA ($62,445) is under reconfirmation — needs 3 consecutive closes above to invalidate the 'failed breakout.' On-chain data shows NUPL recovering to 0.07, exchange balances at a historic low of 6.6%, and whales accumulating 270K+ BTC in the $60K-$63K range. Four scenarios with CPI as the directional catalyst.
Market Overview
| Metric | Value | 24h Change |
|---|---|---|
| Total Market Cap | ~$2.17T | 📈 +1.2% |
| BTC Price | $62,500-$63,300 | 📈 +1.5% |
| ETH Price | $1,734-$1,749 | 📈 +0.4% |
| SOL Price | ~$77-$78 | 📈 +0.9% |
| XRP Price | ~$1.09-$1.10 | 📈 +0.4% |
| BTC Dominance | ~58.24% | Rising |
| Fear & Greed | 28 (Fear) | Improving from 26 |
| 24h Volume | ~$31B | Contracting (panic fading) |
| 24h Liquidations | ~$153M | Long $60M, Short $93M |
| 10Y Treasury | ~4.54% | Declining |
| DXY | ~100.73 | -0.12% |
| WTI Crude | ~$72 | -2.0% |
| VIX | 15.84 | -6.27% |
1. Bitcoin Technical Analysis: Consolidating Ahead of CPI
Today's Price Action
Bitcoin traded in a $62,500-$63,300 range, posting a modest green candle (+1.5%) after yesterday's crash. The key change is volume: today's ~$31B is down 54% from yesterday's $68B panic volume — panic selling has subsided, but the market is now in "wait-and-see" mode ahead of Monday's CPI.
⚠️ Bull vs Bear: A Balanced Picture
| Dimension | Bullish Signals | Bearish Signals |
|---|---|---|
| Flows | ETF outflow streak broken, $143M+ inflows 🟢 | June still recorded $4.5B outflows 🔴 |
| On-chain | Whales accumulating 270K+ BTC in $60K-$63K 🟢 | LTH realized losses at 3.5-year high 🔴 |
| Technical | RSI recovering from oversold to ~42-44 🟡 | 200-week MA not yet confirmed 🟠 |
| Macro | DXY weakening to 100.73, VIX falling to 15.84 🟢 | 10Y yield at 4.54% still elevated 🔴 |
| Geopolitical | Oil retreats to $72, negotiation hopes rise 🟢 | US-Iran root conflict unresolved 🔴 |
| Sentiment | Fear index improving from 26 to 28 🟡 | Still in 'Fear' territory 🔴 |
Overall assessment: Slight bullish edge, but the market lacks a strong catalyst. $62K-$64K range-bound consolidation ahead of CPI appears most likely.
Technical Indicators
RSI (14): Recovered to ~42-44 from yesterday's 38-40 — still in weak territory but off oversold levels.
MACD: Daily MACD fast line is still declining toward the signal line. If BTC doesn't continue rising, a death cross remains a risk.
Moving Averages:
| MA | Level | Status |
|---|---|---|
| 20-day MA | ~$62,100 | ✅ Recovered |
| 200-week MA | $62,445 | ⚠️ Testing |
| 50-day MA | ~$67,800 | ❌ Below |
| 200-day MA | ~$73,800 | ❌ Below |
The 200-week MA ($62,445) is the most important technical level. BTC needs 3 consecutive daily closes above $62,445 to confirm it's reclaimed. Losing it again would confirm medium-term bearish trend.
Volume: ~$31B, down 54% from yesterday's $68B. Low-volume bounces suggest seller exhaustion rather than strong buyer conviction.
Key Levels
| Level | Price | Significance |
|---|---|---|
| Resistance 1 | $63,500-$63,800 | July 9 crash origin; most important near-term resistance |
| Current | $62,500-$63,300 | Post-bounce consolidation |
| Support 1 | $62,000-$62,445 | 200-week MA + round number (CRITICAL) |
| Support 2 | $61,000-$61,500 | July 9 low + 20-day MA |
| Support 3 | $60,000 | Final defense line |
Scenario Probabilities (July 10 Edition)
| Scenario | Prob | Target | Trigger |
|---|---|---|---|
| 📈 CPI beat + BTC breaks $64K | ~30% | $64K-$66K | CPI below expectations, oil falls further, ETFs sustain inflows |
| ➡️ $62K-$64K consolidation | ~45% | Range-bound | CPI expectations digested, stalemate continues |
| 📉 CPI miss + BTC retests $60K | ~25% | $60K-$61K | CPI above expectations, oil rebounds |
Vs yesterday: bullish scenario probability up from 20% to 30% (ETF reversal + geopolitical easing + technical bounce base). Extreme Hormuz scenario reduced from 10% to 0% as oil fell back to $72.
2. Altcoin Analysis
Ethereum (ETH) — Structurally Stronger, $1,734-$1,749
ETH shows relative strength (+0.4%), with a healthier chart structure than BTC. OBV (On-Balance Volume) showing upward trend. Multiple analysts note ETH's K-line structure is cleaner.
- Support: $1,700 (psychological) + $1,680 (recent low)
- Resistance: $1,780-$1,800 (early July high)
- If BTC holds $62K before CPI, ETH could lead the breakout above $1,780
Solana (SOL) — Leading Altcoin Bounce, $77-$78
SOL at ~$77-$78 (+0.9%) — the best performer among top 10. High beta means SOL bounces hardest. On-chain activity remains healthy with $4B+ DeFi TVL.
XRP — Awaiting CLARITY Catalyst, $1.09-$1.10
XRP at ~$1.09-$1.10 (+0.4%). SEC's crypto rules proposed for July and the CLARITY Act draft expected next week are critical catalysts. Technical formation shows a short-term bottom near $1.05-$1.10.
Top 10 by Market Cap
| Rank | Coin | Price | 24h Change |
|---|---|---|---|
| 1 | BTC | $62,500-$63,300 | +1.5% |
| 2 | ETH | $1,734-$1,749 | +0.4% |
| 7 | SOL | ~$77-$78 | +0.9% |
| 6 | XRP | ~$1.09-$1.10 | +0.4% |
| 10 | ADA | ~$0.178 | +0.6% |
3. Macro Deep Dive: Crosscurrents
Tailwinds (Triple Improvement)
- USD weakening — DXY at 100.73, down from recent highs
- VIX plunging to 15.84 — from 20+ during geopolitical shock
- US stocks near all-time highs — S&P 500 7,543, Nasdaq 26,206
Headwinds (Two Structural Concerns)
- 10Y Treasury at 4.54% — suppressing risk asset valuations
- Fed uncertainty — Sept hike odds ~40%+ after hawkish FOMC minutes
Oil-BTC Interaction Framework
| Oil Scenario | BTC Impact | Current Prob |
|---|---|---|
| Oil <$70 | ✅ Strongly bullish — Fed room opens | ~15% |
| Oil $70-$75 | ➡️ Neutral | ~60% |
| Oil $75-$80 | ❌ Bearish — inflation fears | ~20% |
| Oil >$80 | ❌❌ Extreme bearish | ~5% (sharply down) |
Oil retreat from $75+ to $72 significantly reduces the worst-case geopolitical tail risk.
4. On-Chain Data Deep Dive
Core Metrics
| Metric | Value | Status | Historical Note |
|---|---|---|---|
| NUPL | ~0.07 (Anxiety) | Recovered from 0.05 | Near cycle-bottom levels |
| Supply in Profit | ~48% | Slight recovery from 46% | Historically rare |
| Exchange Balance | 6.6% | Declining | Lowest since 2017 |
| Whale Accumulation ($60K-$63K) | 270K+ BTC | Ongoing | Significant |
| 6-Month Put Skew | 4th highest | Slight decline | Still extreme |
| Funding Rate | ~0 (Neutral) | Recovered from negative | Normalized |
Key Takeaways
1. Exchange Balance at 6.6% — Supply Scarcity Intensifies
BTC on exchanges has dropped to 6.6% of total supply — the lowest since 2017. This means:
- Increasingly scarce 'available to sell' supply
- Potential supply shock if new demand enters
- Long-term holders continue moving to self-custody
2. NUPL Recovery to 0.07
NUPL recovering from yesterday's 0.05 (near cycle-bottom) to ~0.07. Historically, NUPL breaking above 0.10 ('Optimism' zone) signals the start of a cyclical uptrend.
3. Funding Rate Normalized
Funding rates returned to ~0 from yesterday's negative — shorts have been squeezed, and long/short are now balanced. This removes the 'short squeeze fuel' but also suggests no immediate directional bias.
Basis Analysis
| Metric | Value | Status |
|---|---|---|
| Perpetual funding rate | ~0 (Neutral) | ✅ Normal |
| Quarterly basis (annualized) | ~4.0% | 🟡 Below healthy 5-10% |
| Options implied volatility | ~55% | Panic premium cleared |
5. Outlook & Trading Strategies
Short-Term Event Calendar
| Date | Event | Impact | Direction |
|---|---|---|---|
| Jul 10-11 | 🔥 BTC quarterly options expiry ($1.4B) | ⭐⭐⭐⭐ | Volatility increase |
| Jul 14 (Mon) | 🔥🔥 June CPI Data | ⭐⭐⭐⭐⭐ | Directional catalyst |
| Next week | 🔥🔥 CLARITY Act integrated draft | ⭐⭐⭐⭐ | Regulatory positive |
| Jul 28-29 | 🔥🔥🔥 FOMC Decision | ⭐⭐⭐⭐⭐ | Medium-term direction |
Scenario Trading Strategies
Scenario 1: $62K-$64K Consolidation (~45%) — Reduce position to <50% before CPI
- Light long at $62,000-$62,500, stop at $61,500
- Reduce at $63,500-$64,000 (range top)
Scenario 2: CPI Beat + BTC Breakout $64K (~30%) — Confirm and add
- Confirmation: CPI below expectations (core CPI <2.8% YoY)
- BTC volume breakout above $63,800
- Add longs, target $66,000-$68,000
Scenario 3: CPI Miss + BTC Retest $60K (~25%) — Protect capital
- Reduce leverage before CPI
- If BTC holds $60,000-$61,000: light long with stop
- If $60K breaks: DO NOT buy the dip; next support $58K-$59K
Weekly Key Metrics Tracker
| Metric | Week Start | Current | Trend |
|---|---|---|---|
| BTC Price | $63,500-$64,000 | $62,500-$63,300 | 📉 Down then bounce |
| 200-week MA | ✅ Above | ⚠️ Testing | ➡️ Pending |
| RSI (14) | ~50 | ~42-44 | 📉 Weak but recovering |
| Funding rate | ~0 (Neutral) | ~0 (Neutral) | ➡️ Normalized |
| Fear & Greed | 24-26 | 28 (Fear) | 📈 Slight improvement |
| BTC Dominance | 54.5% | ~58.24% | 📈 Rising |
Overall assessment: July 10 is a 'calm after the storm' — geopolitical panic has faded quickly, but the market lacks a new directional catalyst. BTC's $62K-$63K recovery bounce is healthy, but the low-volume structure suggests this may be a temporary reprieve rather than a trend reversal. All eyes are on Monday's CPI data — that will be the real directional signal.
⚠️ Risk Disclaimer: This analysis is for informational purposes only. Cryptocurrency investment carries high risk. Always manage your risk carefully.
Getting Started: Binance | OKX
📚 Learning Resource: On-Chain Guide - Blockchain from Zero
Related: