
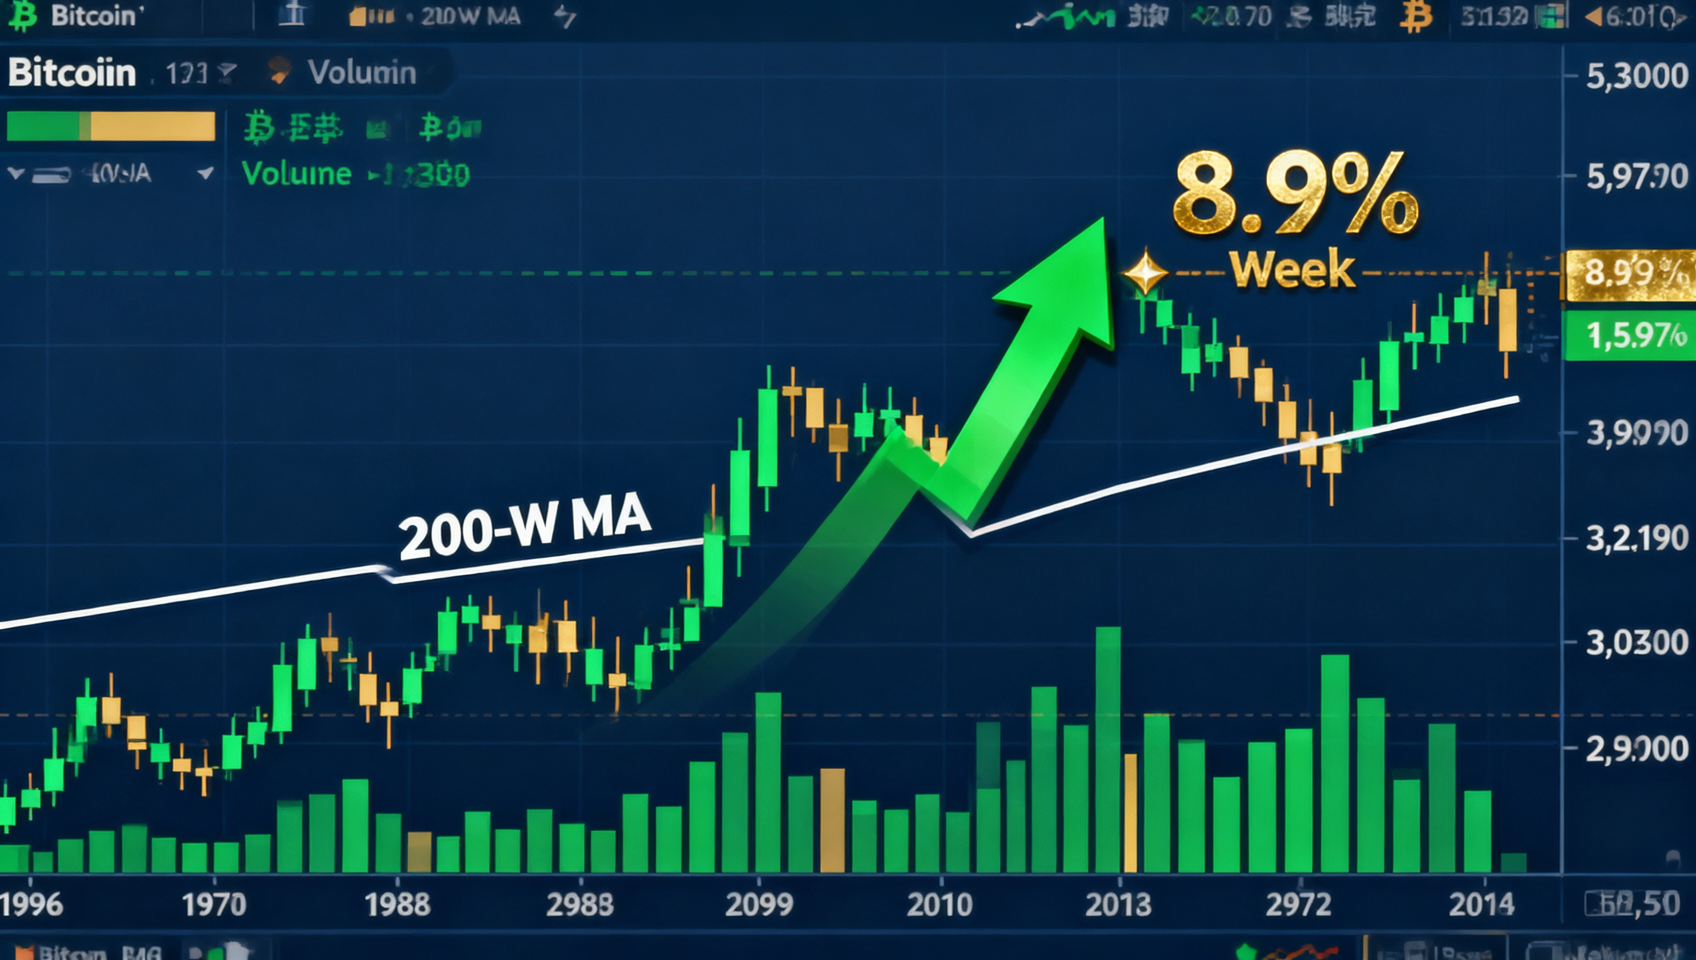
Deep Market Analysis July 5: BTC Breaks Above $63K, Reclaims 200-Week MA; Whale vs Wall Street Divergence at Record Levels; FOMC Minutes + CPI Next Week
Bitcoin rallies from $57,758 low to $63,260 — weekly gain of 8.9% best since March. Reclaims 200-week MA ($62,445) in a key technical breakthrough. Whales accumulate 270K BTC vs ETF $4B outflow — historic divergence. Next week's FOMC minutes and CPI data will determine whether the rally continues.
Market Overview
| Metric | Value | 24h Change |
|---|---|---|
| Total Market Cap | ~$2.18T | +1.2% |
| BTC Price | $62,600-$63,260 | +0.9%~+1.8% |
| ETH Price | $1,763-$1,793 | +1.16%~+2.71% |
| SOL Price | ~$81 | +0.5% |
| XRP Price | ~$1.12 | Flat |
| ADA Price | ~$0.158 | -1.5% |
| BTC Dominance | 55.7% | Slight decline |
| Fear & Greed | 23 (Extreme Fear) | Improved from low of 11 |
| 24h Volume | ~$18.9B (BTC spot) | Holiday-thinned |
1. Bitcoin Technical Analysis
Current Status
BTC has completed a powerful rally from $57,758 to $63,260 this week — a weekly gain of ~8.9%, the best since March 2026. Currently trading in the $62,600-$63,260 range.
Two critical technical breakthroughs this week:
- Reclaimed the 200-week MA ($62,445) — first time since early June
- $60,000 confirmed as support — resistance turned support
Technical Indicators
RSI (14): ~52-55, recovered from ~29 (oversold on June 29) to neutral-bullish — crossed above 50 for the first time in weeks. The rapid recovery (29→53 in 5 days) suggests a technical pullback may be needed.
Moving Averages:
| MA | Level | Status | Significance |
|---|---|---|---|
| 20-day MA | ~$60,800 | ✅ Above | Short-term bullish |
| 200-week MA | $62,445 | ✅ Reclaimed | Key medium-term signal |
| 50-day MA | ~$68,200 | ❌ Below | Medium-term resistance |
| 50-month EMA | ~$65,600 | ❌ Below | Trend reversal confirm |
| 200-day MA | ~$74,000 | ❌ Below | Long-term resistance |
Key Levels
| Level | Price | Significance |
|---|---|---|
| Resistance 3 | $75,000-$80,000 | 200-day MA + historical volume zone |
| Resistance 2 | $68,200-$68,600 | 50-day MA + prior high |
| Resistance 1 | $65,600-$66,000 | 50-month EMA + option ceiling |
| Current | $62,600-$63,260 | Above 200-week MA |
| Support 1 | $62,000-$62,445 | 200-week MA retest zone |
| Support 2 | $60,000 | Psychological + support turned from resistance |
| Support 3 | $58,000 | June low |
Scenario Probabilities
| Scenario | Prob | Target | Trigger |
|---|---|---|---|
| 🟢 Break $65K | ~40% | $65K-$68K | CPI decline + sustained ETF inflows + dovish FOMC |
| 🟡 Range $62K-$65K | ~40% | Consolidation | Awaiting FOMC + CPI catalysts |
| 🔴 Rally fails | ~20% | $60K-$62K | CPI surprise + ETF outflows + macro deterioration |
2. Altcoin Analysis
Ethereum (ETH) — Mixed Performance
ETH at $1,763-$1,793 (+1.16%+2.71%). Still well below 200-day MA (~$2,500). Key resistance: $1,800; support: $1,650. ETH's rally is milder than BTC's — it's following, not leading.
Solana (SOL) — Weekly Strength
SOL at $81. Strong bounce from May lows ($55, +47%), but facing resistance at $80-$85. If macro improves, SOL could push toward $90-$100.
XRP — Consolidating
XRP at ~$1.12, digesting recent gains. Key catalyst remains Ripple's escrow share decline and ongoing SEC sentiment.
ADA — Cooling After Whale Bump
ADA at ~$0.158 (-1.5%), giving back some of the recent whale-driven gains.
Top 10 by Market Cap
| Rank | Coin | Price | 24h Change |
|---|---|---|---|
| 1 | BTC | $62,600-$63,260 | +0.9%~+1.8% |
| 2 | ETH | $1,763-$1,793 | +1.16%~+2.71% |
| 3 | XRP | ~$1.12 | Flat |
| 4 | SOL | ~$81 | +0.5% |
| 5 | BNB | $553 | +0.5% |
| 6 | ADA | ~$0.158 | -1.5% |
3. On-Chain Data Deep Dive
ETF Flows: Positive Week but Divergent Structure
BTC ETFs recorded $527M in weekly net inflows — first positive week in 8. But the internal breakdown tells a nuanced story:
| Product | Weekly Flow | Trend |
|---|---|---|
| Fidelity FBTC | 🟢 +$166M | Largest buyer this week |
| ARKB | 🟢 +$91.8M | Following in |
| VanEck HODL | 🟢 +$4.4M | Small inflow |
| BlackRock IBIT | 🔴 -$40.4M | Day 11 of consecutive outflows ($2.2B cumulative) |
ETF insight: IBIT's persistent bleeding is a caution flag. As the world's largest spot BTC ETF, its flow direction is a key institutional sentiment indicator. Until IBIT stops leaking, we can't say "institutions are fully back."
Whale Accumulation: 270K BTC — A Historic Record
This cannot be overstated: whale wallets accumulated 270,000 BTC (~$16.7B) in the final two weeks of June, the largest such accumulation on record.
| Period | Whale Accumulation | Subsequent BTC Rally |
|---|---|---|
| March 2020 | ~150K BTC | ~18x over 18 months |
| Nov 2022 | ~180K BTC | ~7x over 19 months |
| June-July 2026 | ~270K BTC | ??? |
Caveat: Whale wallet data includes exchange consolidation, custodial reshuffling, and OTC settlement — it's not a pure conviction signal. A similar signal in January 2026 turned out to be exchange wallet maintenance.
Exchange Inflows: Elevated But Declining
Daily BTC exchange inflows have declined significantly from the June 30 peak (~49,000-50,000 BTC), reducing near-term selling pressure.
Futures Market
- 24h liquidations: ~$200M (73% shorts = ~$146M)
- Funding rate: recovered from negative to neutral-positive
- Open interest: moderate recovery to ~$220B
Realized P/L Ratio
CryptoQuant's realized P/L ratio hit -0.35 — lowest in 43 months. Historically, this level has appeared near long-term price bottoms.
4. Macro Context
This Week: The NFP Catalyst
| Metric | Actual | Expected | Prior |
|---|---|---|---|
| Non-farm payrolls | +57K | +114K | +172K |
| Unemployment | 4.2% | 4.3% | 4.2% |
| Apr-May revisions | -74K cumulative | — | — |
Market repricing:
- 10Y Treasury: 4.50% → 4.46%
- Sep cut probability: <10% → ~45%
- Dollar index: biggest weekly drop since early April
Next Week's Key Events
| Date | Event | Impact |
|---|---|---|
| Jul 6 (Mon) | US ISM Services PMI | ⭐⭐⭐ — Services economy signal |
| Jul 7 (Tue) | Fed's Waller speech + ADP employment | ⭐⭐⭐ — Policy signal |
| Jul 9 (Thu) | FOMC June minutes | ⭐⭐⭐⭐⭐ — Reveals rate path divergence |
| Jul 10 (Fri) | US June CPI | ⭐⭐⭐⭐⭐ — Core rate-cut data |
| Jul 11 (Sat) | US June PPI | ⭐⭐⭐ — Inflation leading indicator |
| Mid-Jul | Bitcoin Clarity Act | ⭐⭐⭐ — Regulatory direction |
5. Outlook
Short-term (Weekend-Early Next Week): $62K-$65K Range
BTC has reclaimed the 200-week MA ($62,445), completing a technical shift from "bearish trend" to "range-bound." However, the $65K-$66K zone faces dual pressure from the 50-month EMA and options concentration.
Weekend watchpoints: Whether $63K holds after holiday liquidity returns; Monday volume levels with US traders back; ISM Services PMI.
Medium-term (1-3 months)
| Scenario | Prob | Condition |
|---|---|---|
| Gradual recovery ($62K-$72K) | ~45% | CPI decline + sustained ETF inflows + dovish FOMC |
| Range ($58K-$65K) | ~35% | Mixed macro data + persistent divergence |
| Double dip ($53K-$58K) | ~20% | Inflation rebound + ETF outflows + macro deterioration |
Week Ahead Priorities
- BTC weekly close above $63K — most important technical validation
- FOMC minutes (July 9) — hawk/dove balance determines medium-term direction
- CPI data (July 10) — core validation of the rate-cut trade
- ETF flows Mon-Fri — sustainability of the rally
- Whether BlackRock IBIT stops bleeding — key institutional sentiment indicator
⚠️ Risk Disclaimer: This analysis is for informational purposes only. Cryptocurrency investment carries high risk.
Getting Started: Binance | OKX
📚 Learning Resource: What is Blockchain? Complete Beginner Guide — Blockchain fundamentals and on-chain data analysis tutorials
Related: