


⚠️ Read this first: if you have not registered yet, use the registration link (e.g. "Register now") or invite code BINANBT — registering directly inside the app gets you none of the new-user rewards, and the $19,800 welcome package and 20% fee rebate will not apply. Grid trading pays fees on every cycle, so the rebate matters even more for high-frequency strategies.
Key takeaways (TL;DR):
- Grid trading earns spread × number of fills, not a rising coin price. It repeatedly buys low and sells high inside a range. The more the price oscillates and crosses grid lines, the more grid profit it collects. If price breaks out and stays out, the strategy becomes a passive one-way position.
- Counterintuitive point one: denser grids are not more profitable. Binance spot fees are about 0.1% per side, or 0.2% for a round trip. Each grid gap must clear 0.2% before it earns anything. A 5% range with 100 grids gives 0.05% per grid, so every cycle loses about 0.15%.
- Counterintuitive point two: the displayed annualized yield is a sprint extrapolated to a year. Binance's formula annualizes total profit, including unrealized P&L, by minutes running. In Binance's own example, 688 USDC earned 31 USDC in about 11 days, which annualizes to 150.99%. It is an estimate, not a sustainable return1.
- Counterintuitive point three: the biggest loss is not fees, it is the drawdown after a breakout. Once price falls below the lower bound, the grid stops buying and you hold mostly coins. At about 0.0625% grid profit per cycle, a 20% drawdown needs roughly 320 full cycles to recover.
- Bottom line: grid trading suits people who are genuinely willing to hold the coin in that range and expect a sideways market. It does not suit borrowed money, all-in positions, hot new tokens, or anyone who treats the displayed annualized yield as an expected return.
What is Binance grid trading? In one sentence: it is a bot that places a ladder of limit orders inside a price range you draw, buying at each lower grid and selling at each higher grid to capture the spread. Every completed buy-low, sell-high cycle locks in a small profit. It does not forecast direction; it harvests oscillation.
That sounds like a money printer for sideways markets, but it has three preconditions: price must stay inside the range, volatility must be large enough, and each grid gap must cover fees. If any one fails, the grid turns from spread harvesting into holding a losing position. Using Binance's official formulas and 2026 fees, let us price each precondition.
Table of contents
- What grid trading is: buy low, sell high on repeat
- Counterintuitive point one: denser grids mean more wasted fees
- Counterintuitive point two: the annualized yield assumes the range holds forever
- Counterintuitive point three: grid profit cannot recover a breakout drawdown
- How to set the parameters in five steps
- Spot grid, futures grid or AI parameters
- Decision table: should you run a grid
- Six common ways grid traders lose money
- 💰 Binance rebate: invite code BINANBT
- FAQ
- Further reading
What grid trading is: buy low, sell high on repeat
The core of grid trading is not predicting direction. It is repeating one small action inside a range. You set an upper and a lower price, divide the range into grids, and the system buys one unit every time price falls a grid and sells one unit every time it rises a grid. As price crosses back and forth, profit accumulates.
There are several Binance spot grid details you must know2:
- Two spacing modes: an arithmetic grid has equal price gaps, calculated as (upper − lower) ÷ number of grids. A geometric grid has equal price ratios, calculated as (upper ÷ lower) ^ (1 ÷ number of grids).
- Grid count: minimum 2, maximum 500. With the "move up" feature, the maximum is 170; above 170 the system uses dynamic order placement and move-up is unavailable.
- Separate bot account: the grid lives in a "trading bot account", and funds move there from your spot account. When stopped, funds return to spot, but the state is separate from your normal spot balance.
- Optional trigger price: without one, the strategy immediately buys a portion of the base asset at market to start. With one, it waits for the trigger.
- Stop-loss and take-profit: the stop-loss price must be below the lower bound, the latest price and the trigger price. The take-profit price must be above the upper bound, the latest price and the trigger price.
- Sell all base coins on termination: this is enabled by default for new strategies. When a stop-loss triggers, the remaining coins are sold at market.
- Limits: one account can run up to 50 spot grid strategies at the same time, across any pairs.
The two most overlooked rules are the last two. A stop-loss that sells everything means you do not just stop the loss; you also give up any rebound. If you plan to hold BTC long term and only run a grid with part of it, decide in advance whether "sell all base coins on termination" should stay on.
Counterintuitive point one: denser grids mean more wasted fees
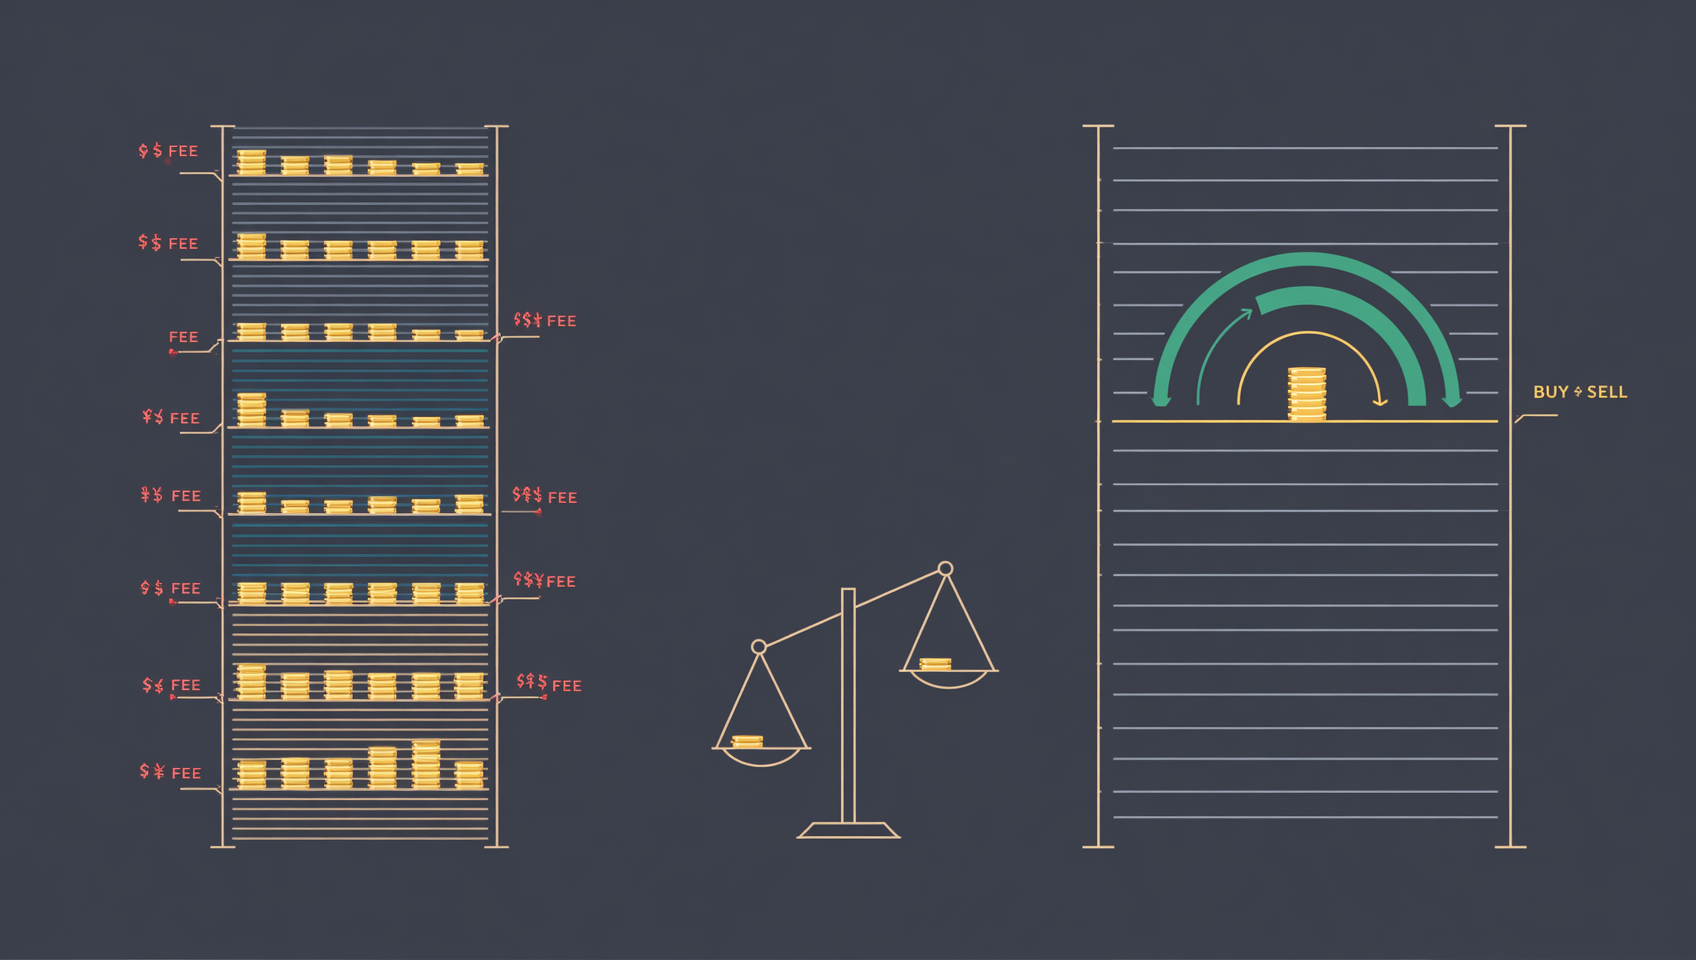
In the grid profit formula, the 0.2% fee is fixed while the price gap shrinks as you add grids. Binance spot grids charge the same fee as spot trading, about 0.1% per side, so a full buy-and-sell cycle costs about 0.2%. Binance's official profit-per-grid formula explicitly uses a fee parameter c = 0.1%1.
Start with a simple counterexample:
Range 60,000–80,000, 100 grids. Arithmetic gap = (80,000 − 60,000) ÷ 100 = 200 USDT. Near 60,000, that gap is about 0.33%; near 80,000 it is only 0.25%. After 0.1% on each side, the net profit per grid is just 0.05%–0.13%.
A more extreme case:
A 5% range split into 100 grids. Gap per grid = 5% ÷ 100 = 0.05%. After the 0.2% round-trip fee, every completed cycle loses 0.15%. This is not "earning a little less". It is "losing a little every time it fills".
Third-party calculations based on Binance's rules are clearer still: for a 60,000–100,000 range with 10,000 USDT invested, 20 grids produce about 1.84%–3.13% net per grid, 40 grids about 0.81%–1.46%, 80 grids about 0.30%–0.63%, and 100 grids about 0.20%–0.47%3. Double the grid count and the per-grid profit roughly halves. At 100 grids, the net is already close to the fee level, and a little slippage or fill delay turns it negative.
So the correct order is not "set 100 grids because it looks professional". It is:
- Set the range.
- Calculate "gap − 0.2%" to get net profit per grid.
- Require at least 0.3% net, then back out the grid count.
- If the math fails, use fewer grids or a wider range. Do not force it.
Counterintuitive point two: the annualized yield assumes the range holds forever
The annualized yield shown on the Binance grid page extrapolates current total profit over the running time. It includes both realized grid profit and unrealized gains and losses. The official formula is1:
Annualized yield = total profit ÷ total investment × 365 × 24 × 60 ÷ minutes running
Official example: 688.04 USDC invested, running 10 days 23 hours 55 minutes, total profit 31.30 USDC, annualized = 31.30 ÷ 688.04 × 365 × 24 × 60 ÷ 15,835 ≈ 150.99%.
That 150.99% is not a lie. It answers one question: if these 11 days repeated for a year, what would the return be? But price does not oscillate at the same pace forever. In practice, the annualized number moves quickly with three things:
- Number of fills: the more often price crosses grid lines, the more grid profit; a flat market pushes the annualized number down.
- Unrealized P&L: total profit includes open positions. A rising coin inflates the number; a falling coin can turn it negative.
- Running time: a strategy that has run a few days is extremely volatile on an annualized basis; the longer it runs, the closer the number gets to reality.
A more realistic way to think is "profit per grid as a share of capital". Take 1,000 USDT, 20 grids, range 60,000–80,000:
Each grid is about 50 USDT. A geometric grid earns about 1.25% net per grid after 0.2% fees. Each completed cycle earns about 0.62 USDT, or 0.062% of total capital. To earn 6.2% of capital, you need about 100 complete cycles.
One hundred cycles means price must cross the range back and forth 100 times. A volatile market might do that in days; a quiet one might take months. The displayed annualized yield tells you what happens if the market keeps oscillating at this pace, not what will happen next.
Counterintuitive point three: grid profit cannot recover a breakout drawdown
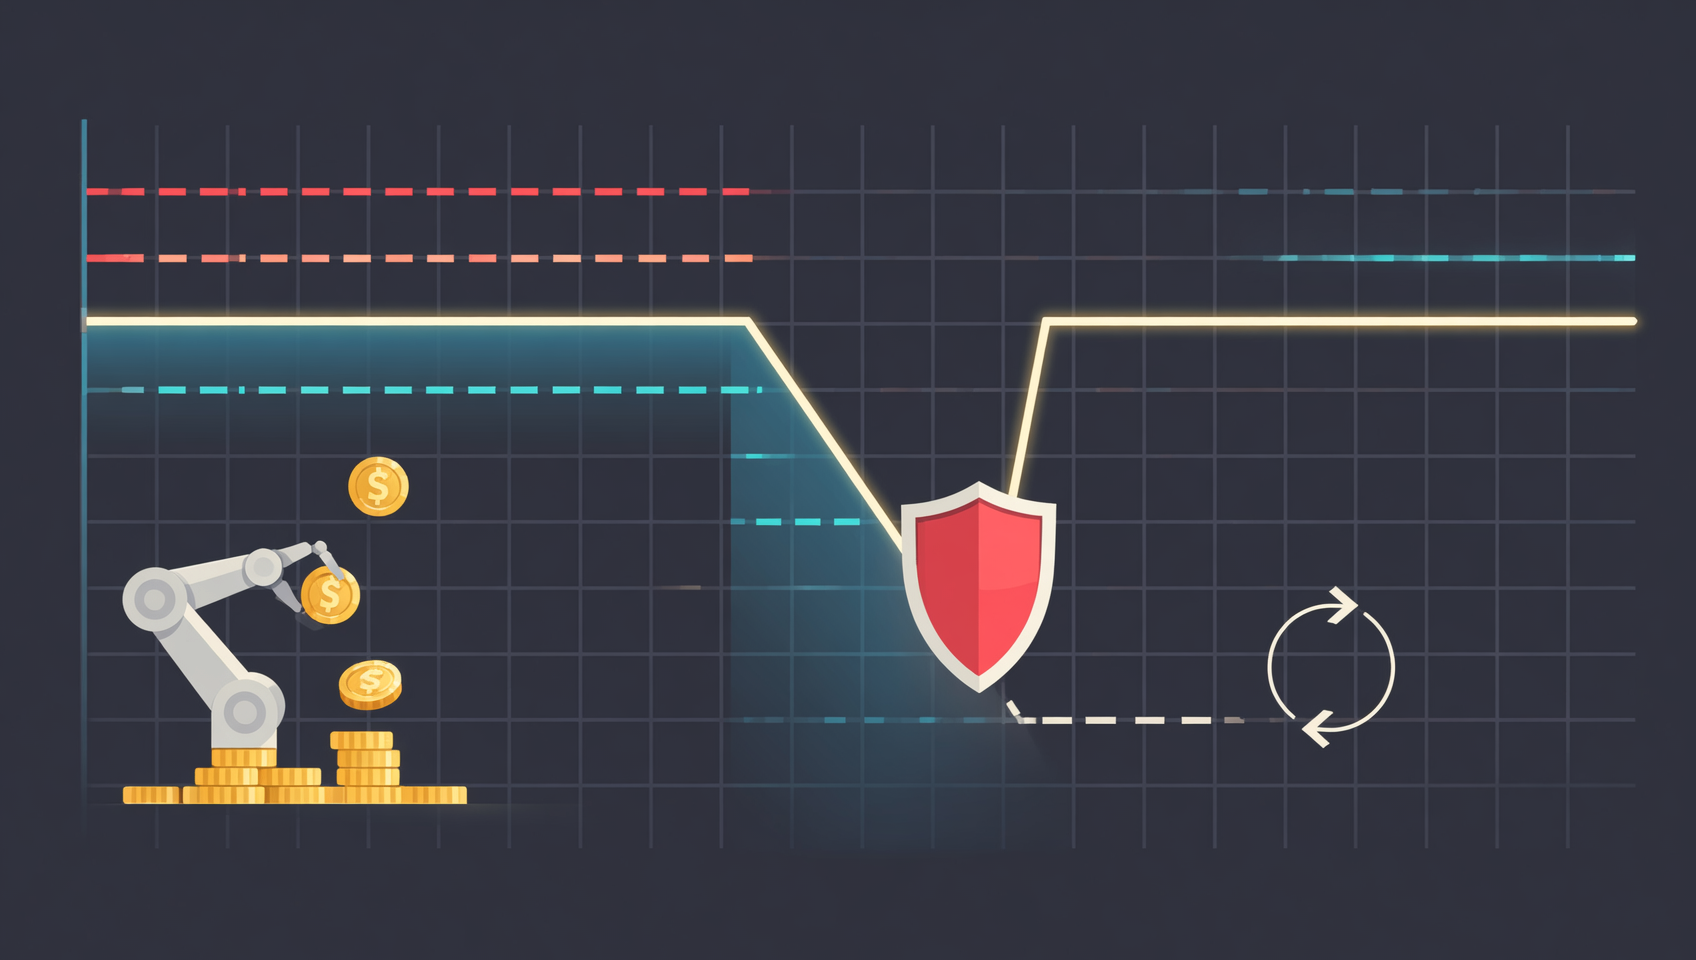
The most dangerous moment for a grid is not high fees. It is price falling below the lower bound. Once below the range, the grid stops buying and you hold mostly coins. As price keeps falling, the unrealized loss scales with your position. Grid profit still accrues, but at the 0.0625% per cycle order of magnitude, it cannot keep up with a 10% or 20% price decline.
Using the same 1,000 USDT, 20 grids, 60,000–80,000 example:
Price falls from 70,000 to 56,000, a 20% decline. The grid keeps buying on the way down; below 60,000 it stops buying, and the account holds mostly BTC. At a 20% drawdown and 0.0625% grid profit per cycle, you need about 320 complete cycles to recover. At a 30% drawdown, you need about 480 cycles.
A third-party backtest in the first half of 2026 illustrates the same point: a spot grid opened in January 2026 with no stop-loss lost about 31.6% by June 30, while simply holding the coin lost about 34.1%. With a stop at 78,000, it triggered on February 1 and lost about 11%3. Two lessons:
- A grid does not hedge a decline. It turns "buy once and hold" into "buy in batches". It still loses when price falls, just somewhat less.
- A stop-loss can cap the loss. A grid without one is a position that keeps buying all the way down. With one, you at least exit when the range breaks.
But a stop-loss has a cost. Binance's spot grid stop price must be below the lower bound, the latest price and the trigger price; once triggered, the strategy stops. If "sell all base coins on termination" is on, the system sells the remaining coins at market, possibly at a local low. A stop-loss protects capital, not your thesis. If you plan to hold long term, the better response to a break below the range may be to stop the grid and keep the spot, then restart when price returns.
How to set the parameters in five steps
Good grid parameters are not the most sophisticated-looking ones. They are the ones where you can explain every number. Follow these five steps in order.
Step one: set the range, not "all-time high to all-time low". The range should come from your view of the next one to three months: the recent trading range, obvious support and resistance, and the prices at which you are willing to buy and sell. Too narrow and price breaks out easily; too wide and each gap grows but fills become rare. A common BTC approach is 10%–15% above and below the current price, but that is not a fixed rule; it depends on volatility.
Step two: calculate net profit per grid, then choose the grid count. Estimate the gap percentage as (upper − lower) ÷ grids ÷ lower, then subtract the 0.2% round-trip fee. If net profit is below 0.3%, do not start, or reduce the number of grids. Do not compress net profit below the fee level because "more grids looks advanced".
Step three: choose arithmetic or geometric. Arithmetic grids have equal price gaps and suit narrow ranges and low-volatility assets. Geometric grids have equal percentage gaps and suit assets with wide price ranges such as BTC and ETH. Binance's recommended parameters default to arithmetic, but you can switch manually2.
Step four: confirm each grid can be ordered. Per-grid investment = total investment ÷ grids. It must exceed the pair's minimum order size, or creation fails. On Binance spot BTC/USDT the minimum order is about 5 USDT, but with lot-size steps and reserved fees the practical amount is higher; the creation page is the authority.
Step five: set a stop-loss and decide what happens to the coins. The stop price must be below the lower bound, the latest price and the trigger price. When triggered, the strategy stops. New strategies have "sell all base coins on termination" enabled by default. If you do not want to be sold out at a low, turn it off. Then the base asset stays in your spot account and you decide whether to hold or sell.
Spot grid, futures grid or AI parameters
The three modes carry very different risk. Beginners should not start with futures grids.
| Mode | What it uses | Leverage | Main risk | Who it suits |
|---|---|---|---|---|
| Spot grid | Your own spot | No | Coin decline, range breakout, fees | First-time grid users |
| Futures grid | Margin + leverage | Yes | Liquidation, funding, margin calls | Experienced contract traders |
| AI parameters | System-generated range and grid count from technical indicators | Depends on spot/futures | Parameters are suggestions, not guarantees | Beginners unsure how to set parameters |
AI parameters are not "AI makes you money". They use moving averages and standard deviations to suggest a range and grid count2. Binance's rules say AI parameters default to arithmetic mode and enable "sell all base coins on termination". You can copy the AI parameters into manual mode and adjust them, but then you still need to recalculate net profit per grid yourself.
Futures grids add two extra costs: funding fees, charged or paid every eight hours depending on position direction, which erode profit over time; and liquidation, which can wipe out margin in an extreme move before grid profit accumulates. If you do not yet understand isolated vs cross margin and liquidation price, do not touch futures grids.
Decision table: should you run a grid
Grid trading is not a question of whether you have money. It is a question of whether you have a clear sideways view and a plan for a breakout. If you cannot answer one of these five questions, do not start.
| Question | If yes | If no |
|---|---|---|
| Do I expect the next 1–3 months to be range-bound, not trending? | Keep evaluating | Do not start; grids hold the bag in trends |
| Am I willing to hold this coin within this range? | A breakout will not panic you | Do not start; a breakout forces you to sell low |
| Is this money unused for 3–6 months? | You can absorb a drawdown | Do not start; urgent money forces a stop |
| Can I accept a 20% drawdown below the lower bound? | Risk is manageable | Reduce size or do not start |
| Do I know a stop-loss will sell all base coins? | You can set it correctly | Read the stop-loss rules first |
A typical good use case: you already hold BTC or ETH long term, want to earn some spread with part of the position during a range, and can accept holding through a breakout. Bad use cases: borrowed money, all your capital in one range, newly listed tokens, or jumping in because you saw "150% annualized".
Six common ways grid traders lose money
- Range too narrow. Price breaks out in two days, the grid stops, you earn a few cycles and miss the move.
- Too many grids. Fees eat the per-grid profit, so more fills mean more losses. A 5% range with 100 grids is the classic example.
- No stop-loss. In a one-way decline the grid keeps buying and the drawdown compounds; the third-party backtest lost 31.6% in half a year without one3.
- Treating annualized yield as return. The 150% figure is a short-run extrapolation, not what you will earn; a month later it can look completely different.
- Leverage in a futures grid. A spot grid's worst case is a drawdown; a futures grid's worst case is liquidation. Leverage speeds up losses and adds funding costs.
- Running grids on hot new tokens. New tokens are volatile and illiquid, and one large candle can pierce the range; grid profit will not cover slippage and breakout losses.
💰 Binance rebate: invite code BINANBT
Every grid cycle pays a fee, so lower the rate first: register on Binance with invite code BINANBT for a 20% trading fee rebate. This article contains a referral link; we may receive a reward if you register through it, but it does not cost you anything extra.
- Rebate: 20% of trading fees, ongoing, and it grows with your volume.
- Welcome package: up to $19,800, unlocked by tasks, not cash on registration.
- How to claim: enter BINANBT in the invite code field when registering. That is the most reliable way.
- Important: registering directly inside the app gets you none of the new-user rewards. In-app registration is not tied to any referral relationship, so the $19,800 welcome package and the 20% rebate will not apply. You must use the registration link or enter invite code BINANBT.
👉 Register on Binance and claim the 20% fee rebate
FAQ
What is Binance grid trading, and does it really make steady money?
Grid trading automatically places a ladder of buy and sell orders inside a price range you set. It earns the spread on each completed buy-low, sell-high cycle, not from the coin going up. It can make money only if you are right that the market will stay range-bound and the price will not break out. In a one-way decline, the bot keeps buying and ends up holding the coin, and the unrealized loss can dwarf the grid profit. In a one-way rally, it sells out early and misses the rest. It is not a fixed-income product.
What is the minimum investment for Binance grid trading?
Binance does not publish one universal minimum. The real floor depends on the pair's minimum order size and how many grids you set. On Binance spot BTC/USDT, the minimum order is about 5 USDT, but every grid must clear that threshold, so more grids and smaller per-grid amounts make creation fail more often. In practice BTC/USDT grids often start around 100 USDT and ETH/USDT around 50 USDT, but the creation page is the final authority.
Is more grids always better?
No. Every completed cycle pays two fees. Binance spot charges about 0.1% per side, so a round trip costs about 0.2%. Each grid's price gap must be meaningfully larger than 0.2% to leave a net profit. A 5% range split into 100 grids gives just 0.05% per grid; after 0.2% in fees, every cycle loses about 0.15%. Dense grids mostly pay the exchange, not you.
How is the annualized yield on Binance grid trading calculated, and why is it so high?
Binance's formula is total profit ÷ total investment × 365 × 24 × 60 ÷ minutes running. It annualizes a short-run total profit that includes unrealized gains and losses, so a strategy that has run for a few days can show more than 100%. In Binance's own example, 688.04 USDC earned 31.30 USDC over about 11 days, which annualizes to 150.99%. That is an extrapolation, not a promised return, and it collapses when the range breaks.
Should I set a stop loss on a grid?
Yes, strongly consider it. Binance spot grids support a stop-loss trigger price, which must be below the lower range, the latest price and the trigger price. When triggered, the strategy stops. Note that "sell all base coins on termination" is enabled by default, so a stop-loss sells your coins at market and may lock in a local low. Whether to keep that option on depends on whether you want to exit or keep the spot position.
What is the difference between spot grid and futures grid?
A spot grid uses only the spot you own, cannot use leverage, and the worst case is an unrealized loss as the coin falls. A futures grid uses margin and leverage, can open shorts, and adds liquidation, funding fees and margin-call risk. Beginners should start with spot grids, get the range, grid count and stop-loss right, and only then consider futures grids. Futures grids can lose money much faster.
What market conditions and coins suit grid trading?
It suits markets with clear upper and lower boundaries, enough volatility, and no sustained breakout, plus coins you are happy to hold within that range, such as BTC and ETH. It does not suit one-way trends, newly listed tokens, illiquid small caps, borrowed money or your entire portfolio. Before starting, answer: if price falls 20% below the lower bound, am I willing to keep holding?
Can users in mainland China use Binance grid trading?
Mainland China restricts crypto-related business activity, and offshore platforms serving mainland residents carry legal risk. This article explains product mechanics and risks for educational purposes only and does not describe how to evade restrictions, circumvent risk controls or move money across borders. Confirm your local rules before participating.
Further reading
- Binance futures guide: USDT-margined perpetuals, leverage and liquidation
- Binance spot trading guide: limit, market and stop orders
- How to cut Binance fees: BNB discount, VIP tiers and rebates
- Binance Earn: flexible, fixed, dual investment and Launchpool
- Spot vs futures: a beginner guide
- Binance account frozen: three types and how to appeal
- More Binance guides
Disclaimer: This article is for educational purposes only and is not investment advice. Grid trading carries range-breakout, one-way trend, fee erosion, slippage, futures liquidation and funding-fee risks, and in extreme cases you can lose most of your principal. The annualized yield shown by Binance is an extrapolation based on running time, not a forecast; backtest data comes from third parties and does not guarantee future results. Product rules, fees and grid limits may change, so rely on Binance's pages and official announcements. Rules differ by jurisdiction; confirm your own compliance.
Footnotes
-
Source: Binance official FAQ "Spot Grid Trading Parameters", updated January 7, 2026 (fee parameter c = 0.1%; arithmetic and geometric profit-per-grid formulas; annualized yield = total profit ÷ total investment × 365 × 24 × 60 ÷ minutes running; official example of 688.04 USDC, 31.30 USDC and 150.99%). ↩ ↩2 ↩3
-
Source: Binance official FAQ "What Is Spot Grid Trading?", updated August 13, 2026 (arithmetic and geometric formulas; 2–500 grids; move-up limit of 170 grids; up to 50 spot grid strategies; trigger price; stop-loss below lower bound, latest price and trigger price; take-profit above upper bound, latest price and trigger price; "sell all base coins on termination" enabled by default); Binance official FAQ "How to Use Auto Parameters for Spot Grid Trading" (AI, popular and manual parameter modes; arithmetic default). ↩ ↩2 ↩3
-
Source: third-party grid parameter calculations and a first-half 2026 backtest (for a 60,000–100,000 range with 10,000 USDT, net per grid of about 1.84%–3.13% at 20 grids, 0.81%–1.46% at 40, 0.30%–0.63% at 80 and 0.20%–0.47% at 100; a spot grid opened in January 2026 with no stop-loss lost about 31.6% by June 30 versus about 34.1% for holding, while a stop at 78,000 triggered on February 1 with about an 11% loss). Backtests do not guarantee future results and are used only to illustrate breakout risk. ↩ ↩2 ↩3