

Crypto News Deep Review July 15: BTC Breaks $65K for First Time in 3 Weeks, June CPI Cools to 3.5% Fueling Rate Cut Hopes, Whale $4.3B Dump vs $710M Accumulation, Upbit Volume Surges 1,318%, Crypto Social Volume at 21-Month Low — Bullish Signal, ECB Launches Digital Euro Pilot
Bitcoin surged past $65,000 (+3.5%) today for the first time since June 23, fueled by a softer-than-expected June CPI print (headline 3.5%, core 2.6%) that boosted rate-cut probabilities to 45% for September. Whale activity shows sharp divergence: the 100-1K BTC cohort dumped 67,000 BTC ($4.3B) — their largest daily sell-off since February — while the 10-10K cohort accumulated 11,000 BTC ($710M). South Korea's KOSPI bear market drove a 1,318% surge in Upbit volume to $4.2B, with XRP outpacing BTC on the exchange. Crypto social chatter fell to 41,800 daily comments — a 21-month low — which Santiment flags as a historically bullish signal. The ECB selected 36 participants for its digital euro pilot. The US government moved $297M in BTC/ETH to Coinbase Prime. JPMorgan warned Hyperliquid's growth poses risks to Circle and Coinbase.
Today's Headlines
| Event | Key Point |
|---|---|
| 📈 BTC Breaks $65K | +3.5% in 24h, first time above $65K since June 23; June CPI cools to 3.5% as catalyst |
| 📊 June CPI Below Expectations | Core CPI falls to 2.6% (est. 3.0%); rate cut hopes surge, risk assets rally across the board |
| 🐋 Whale $4.3B Dump vs $710M Accumulation | 100-1K BTC wallets dump 67,000 BTC ($4.3B) — largest daily since Feb; 10-10K wallets accumulate 11,000 BTC |
| 🛢️ US-Iran Conflict Continues but BTC Desensitized | Hormuz closure persists but BTC reacts minimally; capital rotates from AI stocks into crypto |
| 🏦 ETF Flows Mixed | $181M net inflow on July 14, but Friday's $425M outflow still weighs; Citi cuts BTC target to $82K |
| 🇰🇷 Upbit Volume Surges 1,318% | KOSPI enters bear market; capital floods into crypto; XRP volume surpasses BTC on Upbit |
| 🏛️ ECB Advances Digital Euro Pilot | 36 participants selected (Deutsche Bank, Revolut, Stripe); testing to begin H2 2027 |
| 🔇 Social Volume at 21-Month Low | 41,800 daily comments; Santiment says "silence is bullish" |
| 😨 Fear & Greed Index at 25 | Still in "Extreme Fear" but up 3 points from 22 last week |
1. 📈 BTC Breaks $65K: CPI Rate-Cut Hopes Ignite Rally
Bitcoin broke through $65,000 for the first time since June 23, trading at $64,600-$65,055 with a 24-hour gain of approximately +3.5%. The core catalyst was June CPI data coming in well below expectations — headline CPI fell to 3.5% YoY (prior 4.2%, est. 3.8%), and core CPI dropped to 2.6% (est. 3.0%), its lowest since August 2025.
| Metric | Value | 24h Change |
|---|---|---|
| BTC | $64,600-$65,055 | 📈 +3.5% |
| ETH | $1,876-$1,886 | 📈 +4.7%~+5.8% |
| Total Market Cap | ~$2.30T | 📈 +3.5% |
| BTC Dominance | ~57.8% | 📉 Slight decline (altcoins catching up) |
| Fear & Greed Index | 25 (Extreme Fear) | Up 3 from 22 |
| 24h Liquidations | ~$180M (65% shorts) | Shorts squeezed |
| Stablecoin Market Cap | ~$161.4B | ➡️ Slight growth |
CPI Data Breakdown
| Indicator | Actual | Expected | Prior | Impact |
|---|---|---|---|---|
| Headline CPI YoY | 3.5% | 3.8% | 4.2% | ✅ Below expectations, BULLISH |
| Core CPI YoY | 2.6% | 3.0% | 3.1% | ✅ Well below expectations, STRONGLY BULLISH |
| CPI MoM | 0.0% | +0.1% | +0.2% | ✅ Price growth stalls |
| Core CPI MoM | +0.1% | +0.3% | +0.1% | ✅ Core inflation continues declining |
The CME FedWatch tool now assigns an 85.6% probability of rates remaining unchanged at the July FOMC meeting, while September rate-cut odds jumped from ~15% to ~45% — the highest level this year.
Full Market Reaction
| Asset Class | Change | Interpretation |
|---|---|---|
| BTC | +3.5% | Breaks $65K psychological barrier |
| ETH | +4.7%~+5.8% | Leading the rally |
| S&P 500 | +0.8% | Tech stocks lead |
| Nasdaq | +1.2% | AI sector rebounds |
| Gold | $4,105 (+0.5%) | Modest gains |
| Brent Crude | $79.80 (-0.3%) | Slight decline |
| DXY | 99.85 (-0.6%) | Weakening USD, bullish for risk assets |
Key insight: The June CPI print is this month's most important macro catalyst, and the actual numbers significantly beat expectations. 3.5% headline and 2.6% core CPI open the door for a September rate cut — exactly what the market has been waiting for months. BTC's $65K breakout is no coincidence: it rests on both sound macro logic and positive capital flows.
2. 🐋 Whale Activity Divergence: $4.3B Dump vs $710M Accumulation
Event Overview
On July 13, the 100-1,000 BTC whale cohort recorded its largest single-day sell-off since February — 67,000 BTC (approximately $4.3 billion) moved to exchanges or OTC platforms.
Simultaneously, the 10-10,000 BTC cohort accumulated approximately 11,000 BTC ($710 million) over the past week.
Interpretation: Supply Rotation, Not Exit
| Whale Cohort | Action | Volume | Interpretation |
|---|---|---|---|
| 100-1K BTC | ❌ Selling | 67,000 BTC ($4.3B) | Short-term profit-taking |
| 10-10K BTC | ✅ Accumulating | ~11,000 BTC/week | Long-term holders buying |
| Net Effect | ➡️ | ~56,000 BTC net sell pressure | Far below monthly averages |
The behavioral divergence suggests this is supply rotation, not systematic whale exit. Early holders (100-1K cohort) are taking profits, while new capital (10-10K cohort) absorbs supply near $64K — a classic mid-bull market signal.
Exchange Balances Continue to Decline
Despite the whale sell-off, BTC exchange balances continue falling to approximately 1.29M BTC — about 6.5% of circulating supply, a new 7-year low.
Key insight: The 67,000 BTC sell-off looks alarming but represents only 0.3% of circulating supply in a $2.15T market. More importantly, exchange balances are still declining — the selling was mostly done OTC, not dumped on open markets. $4.3B in selling was absorbed by $710M/week in accumulation; net demand still exceeds supply.

3. 🏦 ETF & Institutional Dynamics: Mixed Signals
BTC ETF Inflows: Volatile but Trending Positive
BTC ETF flows show high volatility this week:
| Date | Net Flow | Leader |
|---|---|---|
| July 10 (Thu) | +$209M | BlackRock IBIT |
| July 11 (Fri) | -$425M | Multiple funds |
| July 14 (Mon) | +$181M | Fidelity FBTC + ARKB |
| Since July 2 cumulative | +$177M | Net positive but small |
Citigroup Cuts BTC Target to $82K
Citigroup published a new report cutting its 12-month BTC price target from $112,000 to $82,000 (bear case $53,000), citing:
- Persistently weak investor risk appetite
- Slow progress on US crypto legislation (CLARITY Act)
- ETF inflow recovery slower than expected
Notably, Citi also stated BTC may be entering the "final quarter of the bear market."
JPMorgan Flags Hyperliquid Risk
JPMorgan warned that Hyperliquid's rapid growth poses risks to Circle and Coinbase, as Hyperliquid's USDC distribution channels erode traditional CEX market share. The report characterized the revenue-sharing arrangement as a "prisoner's dilemma" that could pressure USDC economics over time.
US Government Moves $300M in Crypto to Coinbase Prime
On July 14, the US government transferred approximately 3,941 BTC and 30,007 ETH (~$297M total) to Coinbase Prime wallets — likely preparation for sale. This is the largest government crypto transfer since August 2024.
Key insight: Institutional signals are mixed. ETF flows are transitioning from heavy outflows to recovery but haven't stabilized. Citi's target cut reflects cautious institutional sentiment, but the "final quarter of bear market" framing also implies the bottom may be near. The $300M government transfer is a potential short-term headwind.
4. 🗾 South Korea: KOSPI Bear Market Drives Capital to Crypto
Event Details
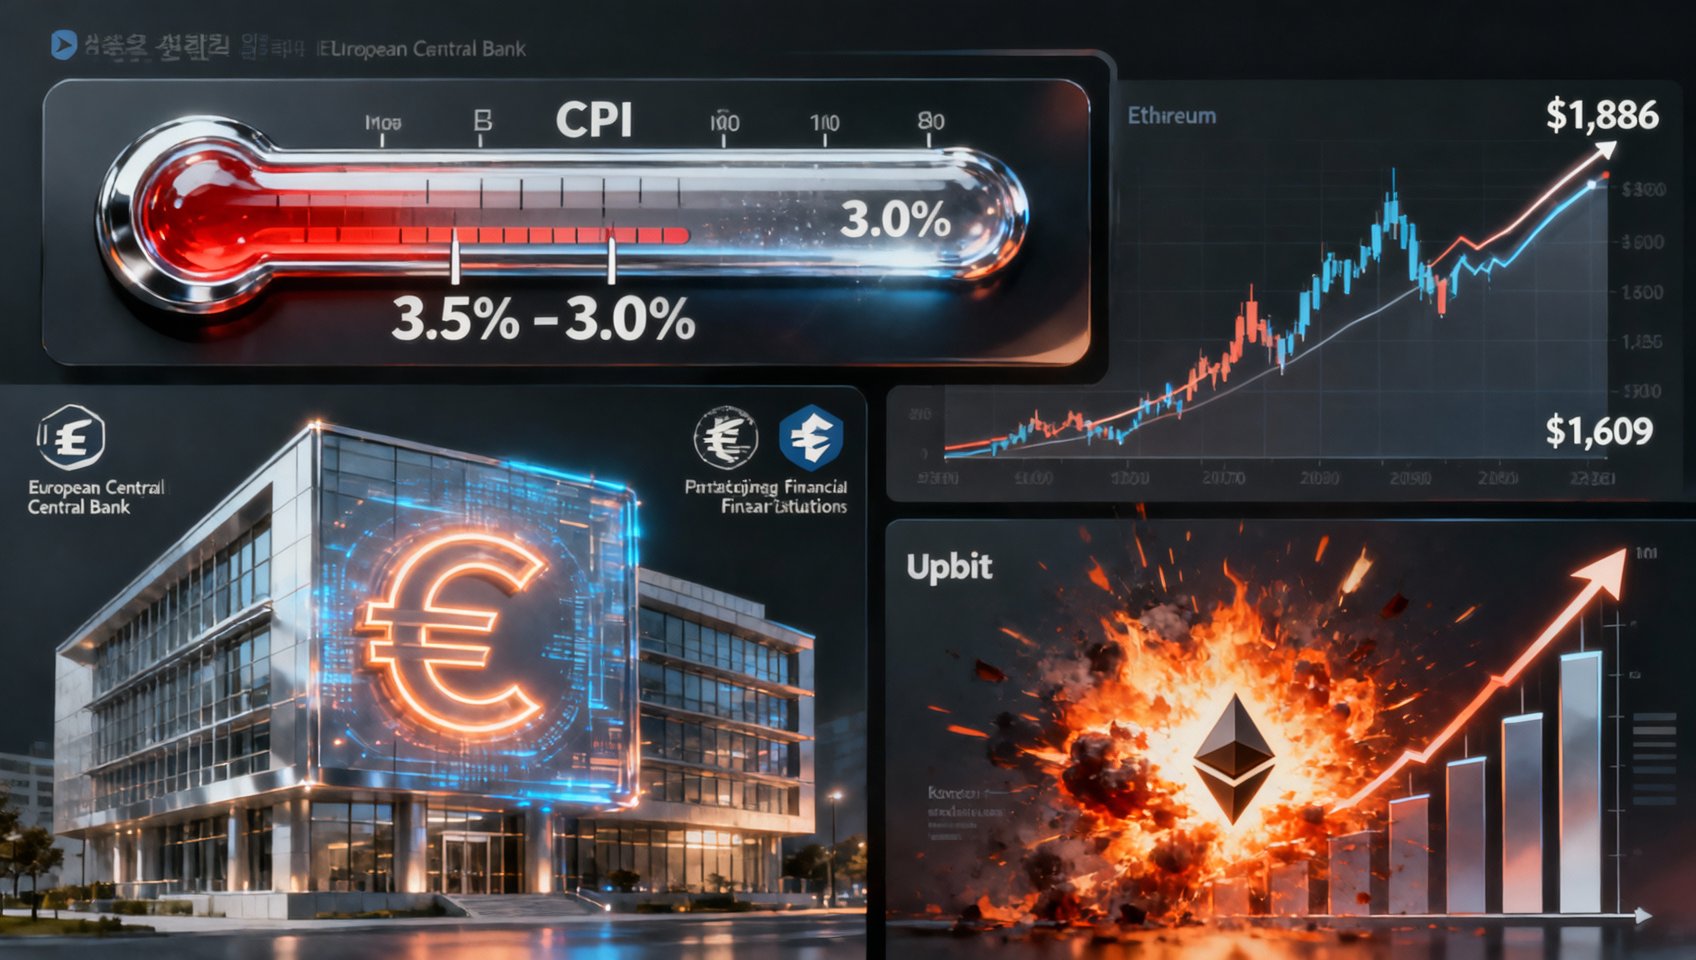
The KOSPI has entered a technical bear market, triggering a massive capital rotation from equities into crypto. Upbit's daily trading volume hit $4.2 billion — a 1,318% surge from recent averages.
Key Observations
| Data Point | Value | Interpretation |
|---|---|---|
| Upbit 24h Volume | $4.2B | 1,318% surge |
| XRP Volume on Upbit | >BTC | XRP has exceptionally high retail interest in Korea |
| Kimchi Premium | +0.5% (turned positive) | Was -0.4% last week; Korean retail sentiment recovering |
| Leveraged Accounts | ~1.2M accounts triggered margin calls | Some capital may be forced repositioning |
BTC Price Impact
Korean capital inflows are an important marginal driver of global crypto liquidity. Historically, Korean exchange volume surges often correlate with short-term price gains. However, some of this capital may come from leveraged equity accounts forced to unwind — the sustainability of these flows is uncertain.
Key insight: The KOSPI bear market → capital rotation to crypto is a structural shift worth tracking. If Korea's economic conditions continue deteriorating, crypto may see sustained "capital flight" inflows. But if this is forced liquidation recycling, sustainability is limited.
5. 🔇 Social Volume at 21-Month Low — Historically Bullish
Data Interpretation
Santiment data shows crypto social media daily comments have fallen to 41,800 — the lowest level since summer 2024. The concentration of actively discussed coins is also declining, suggesting broad market interest has faded.
Santiment's View
"Quiet crowd, low enthusiasm, and plenty of sidelined disbelief — this is the classic recipe for market reversals."
Historical data shows social volume bottoms often coincide with price bottoms:
| Period | Social Volume | Subsequent Move |
|---|---|---|
| September 2023 | Cycle low | BTC from $25K to $49K (+96%) |
| August 2024 | Cycle low | BTC from $49K to $108K (+120%) |
| July 2026 | 21-month low | ? |
On-Chain Corroboration
The low social volume is consistent with on-chain data:
- Long-term holder supply at record 16.75M BTC (~84% of circulating supply)
- Long-term holders flipped back to net buying on July 11-12
- Exchange balances at 7-year lows
Together, these create a "supply vacuum" setup — when social attention returns, pent-up demand could be released in a concentrated burst.
Key insight: Extremely low social volume is itself a market bottom signal. When no one is talking about crypto anymore, prices have often already bottomed. Combined with long-term holder accumulation and declining exchange balances, the current structure closely resembles the September 2023 and August 2024 bottoms.
6. 🇪🇺 ECB Digital Euro Pilot Launches: 36 Institutions Selected
The European Central Bank announced on July 15 that it has selected 36 participants for its digital euro pilot, including:
- Traditional banks: Deutsche Bank, BNP Paribas, Santander
- Fintechs: Revolut, Stripe, Worldpay
- Payment processors: Nexi, Worldline
- Technology providers: Multiple blockchain infrastructure companies
The pilot will run for 12 months, with formal testing expected to begin in H2 2027.
Market impact:
- Short-term (neutral): CBDCs target different use cases than decentralized crypto
- Long-term (bullish): CBDC promotion increases public awareness and acceptance of digital assets
- Regulatory signal: Europe's proactive stance supports broader crypto regulatory maturity
Key insight: The ECB digital euro pilot is a major milestone for global central bank digital currencies. The diverse selection of 36 participants shows traditional finance's growing commitment to digital assets. This is positive for crypto's long-term development, though short-term price impact is limited.
7. 📊 Altcoin Performance: ETH Leads, BONK Tops Memes
Top 10 Performance
| Coin | Price | 24h Change | 7d Change |
|---|---|---|---|
| BTC | $64,600-$65,055 | +3.5% | +10.3% |
| ETH | $1,876-$1,886 | +4.7%~+5.8% | +13.5% |
| XRP | $1.10-$1.11 | +3.5%~+3.8% | +6% |
| SOL | ~$77.59 | +2.9%~+3.6% | +7% |
| DOGE | ~$0.074 | +2.6%~+3.0% | +4% |
| BNB | ~$580 | +2% | +5% |
Top 24h Gainers
| Coin | Gain | Catalyst |
|---|---|---|
| Zcash (ZEC) | +8.8% | Privacy narrative |
| Chainlink (LINK) | +5.2% | RWA oracle demand |
| BONK | +8.0% | Meme coin rally on CPI tailwind |
| ETH | +4.7%~+5.8% | ETF inflows + Foundation news |
ETH Analysis
ETH has rebounded ~16.8% from its late-June low of $1,609, outperforming BTC's 10.3%. ETH/BTC recovered to 0.0292.
ETH catalysts stacking:
- ETH ETF inflows ($84.4M last week)
- Ethereum Foundation spinout EthSystems — institutional privacy infrastructure
- Glamsterdam upgrade (target late Q3 2026) — gas limit to 200M, up to 10,000 TPS
- Robinhood L2 launch
ETH technicals:
- Resistance: $1,900-$2,000 (200-day MA + psychological)
- Support: $1,700-$1,750 (short-term)
- Warning: ETH weekly chart shows a death cross (50-week MA below 200-week MA) — the technical trend remains bearish
- Daily EMA50 at $1,806 — currently breaking above
Key insight: Ethereum's catalyst density may be the highest since 2026 began. ETF inflows, L2 expansion, upgrade expectations, and institutional adoption are converging. But the $1,900-$2,000 resistance zone is formidable — it hosts the 200-day MA and months of trapped longs.
8. 🔮 Outlook: What Comes After $65K
Significance of the $65K Breakout
$65,000 is this rally's most important psychological and technical milestone. Breaking above $65K on dual catalysts (CPI + institutional flows) upgrades the rally's status from a relief bounce to a trend shift attempt.
Key Levels After $65K
| Level | Price | Significance |
|---|---|---|
| Resistance 4 | $73,000-$74,000 | 200-day MA (FxPro target) |
| Resistance 3 | $70,000 | Psychological round number |
| Resistance 2 | $66,500-$67,000 | 50-month EMA + prior resistance |
| Resistance 1 | $65,500-$65,800 | Post-breakout confirmation zone |
| Current | $64,600-$65,055 | $65K just broken, needs confirmation |
| Support 1 | $63,000-$63,500 | Pre-breakout consolidation range |
| Support 2 | $62,445 (200-week MA) | Medium-term core support |
| Support 3 | $60,000 | Last defense for bulls |
FxPro Technical Analysis
FxPro analysts note that the crypto market has broken above its 50-day moving average for the first time since the March correction began. If BTC can hold above $65K, a move toward $73,000-$74,000 (200-day MA) is possible.
Remaining Catalysts This Week
| Date | Event | Impact | BTC Direction |
|---|---|---|---|
| This week | 🔥🔥🔥 CLARITY Act Senate Hearing | ⭐⭐⭐⭐⭐ | Regulatory direction |
| Before July 27 | 🔥🔥 US-Iran Talks Progress | ⭐⭐⭐ | Geopolitical premium |
| July 28-29 | 🔥🔥🔥 FOMC July Rate Decision | ⭐⭐⭐⭐⭐ | Medium-term direction |
| July 30 | 🔥🔥 Strategy Q2 Earnings | ⭐⭐⭐ | BTC strategy update |
Three Scenarios
| Scenario | Prob | BTC Target | Trigger |
|---|---|---|---|
| 📈 $65K holds, rally to $70K-$74K | ~35% | $68K-$74K | CPI tailwind continues + CLARITY hearing positive + FOMC holds + ETF inflows $200M+/day |
| ➡️ $63K-$66K range, digesting gains | ~45% | $65K ± $1.5K | CPI digested, market waits for CLARITY + FOMC |
| 📉 $65K fakeout, retest $62K-$63K | ~20% | $61K-$63K | CLARITY stalls + US-Iran escalation + US gov sells + ETF outflows resume |
Overall Assessment
As of July 15, the key change is that BTC has broken $65K — the rally's most important milestone yet. From the July 1 low of $57,950 to today's high of $65,055, the rally stands at +12.2% over 14 days.
Three core variables to watch:
- $65K confirmation — needs consecutive daily closes; if held for 3 days, target shifts to $68K-$70K
- CLARITY Act hearing (this week) — the biggest regulatory variable
- FOMC July 28-29 — CPI lowered rate-hike odds, but market needs FOMC's official stance
The June CPI report is the best macro data point in months, providing a clear "rate-cut narrative" anchor. If this week's CLARITY hearings also deliver positive signals, BTC could sustain a $65K-$70K upward channel heading into the FOMC decision.
⚠️ Risk Disclaimer: The market is in a post-CPI digestion period before the FOMC decision. Short-term technical pullbacks are possible due to overbought conditions. The $65K breakout needs volume confirmation. Cryptocurrency investment carries high risk. This article is for informational purposes only and does not constitute investment advice.
📚 Learning Resource: On-Chain Guide - Blockchain from Zero
Related: