
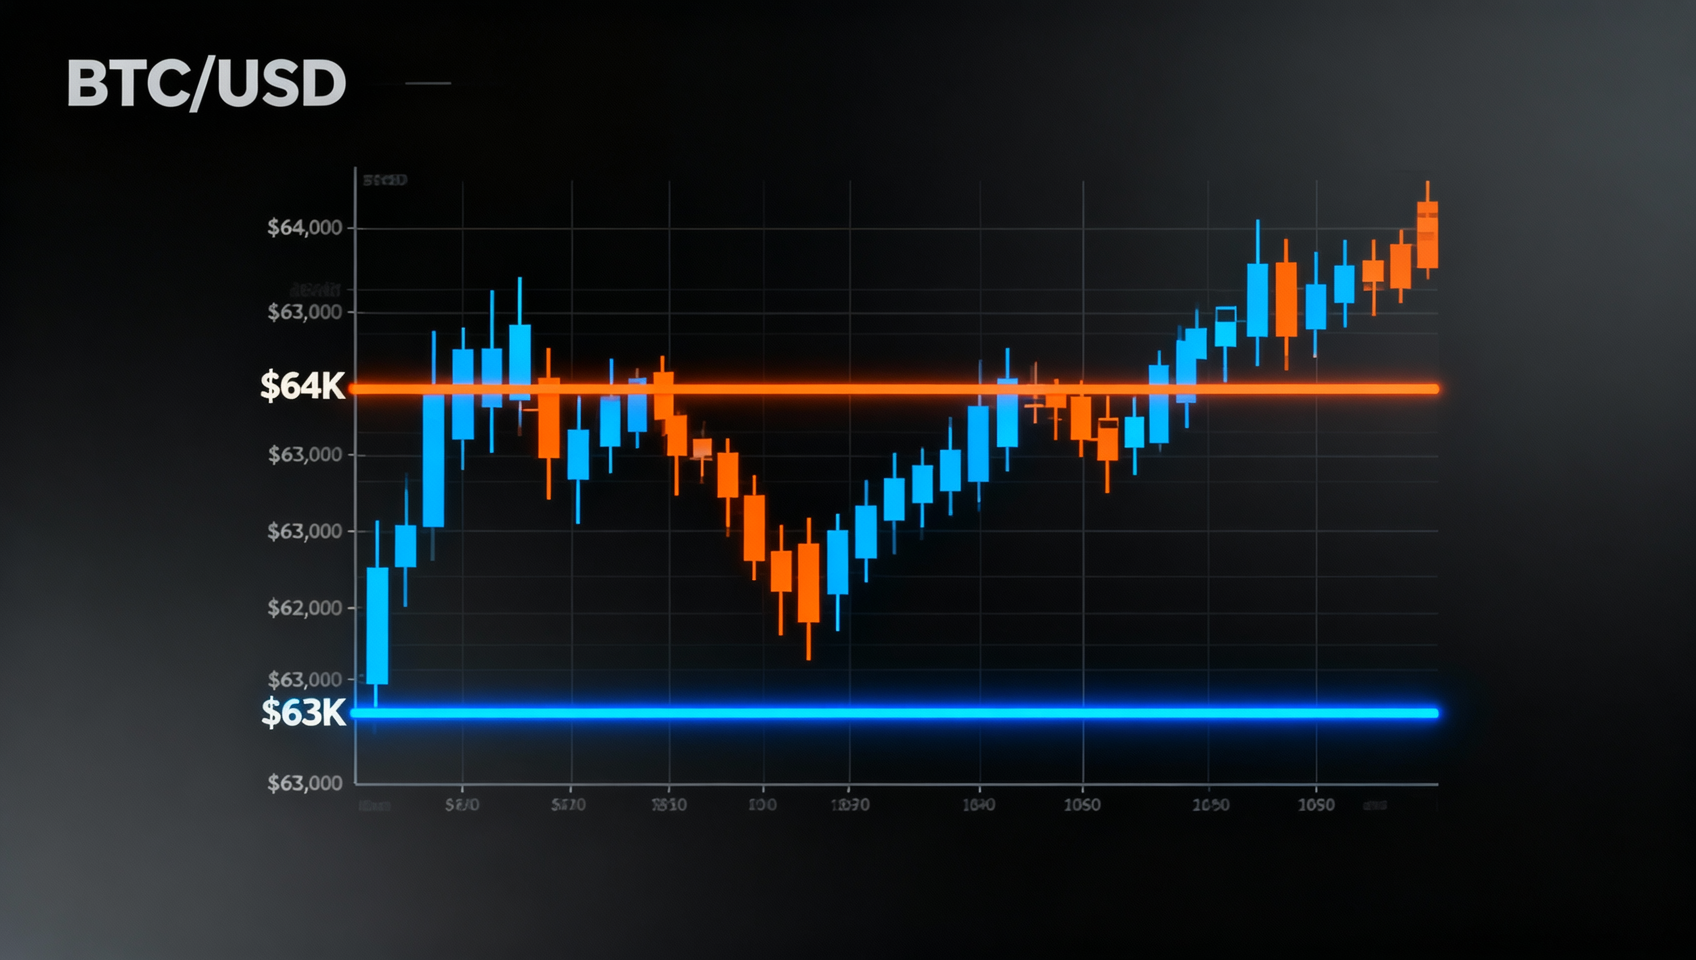
Deep Market Analysis July 12: BTC Consolidates in $63K-$64K Range, Hormuz Strait Closure Triggers Risk-Off, BTC/Gold Ratio Hits Extreme Oversold Signaling Potential Major Reversal
BTC trades in $63.7K-$63.8K range over the weekend, down 0.6% on the day. Iran's IRGC Hormuz Strait closure sends oil surging, risk assets under pressure. BTC shows bid resilience near $63K. Polymarket: 99.2% BTC above $60K, 63.5% above $64K. BTC/Gold ratio at deepest oversold since 2010 (−1.81σ). Technically $64K is the pivot — break above targets $66K, failure retests $62K. Fear & Greed at 26 (Fear).
Market Overview
Bitcoin traded in a narrow $63,700-$63,800 range on July 12 weekend, down approximately 0.6% in 24 hours. The IRGC's closure of the Strait of Hormuz triggered a global risk-asset selloff, but BTC showed relative resilience — only a modest pullback from the $64K level.
| Metric | Value | 24h Change |
|---|---|---|
| BTC | $63,700-$63,800 | 📉 −0.6% |
| ETH | $1,770-$1,785 | 📉 −1.2% |
| Total Market Cap | ~$2.18T | 📉 −0.8% |
| 24h Volume | ~$52B | Weekend contraction |
| BTC Dominance | ~58.8% | 📈 +0.2% |
| Fear & Greed | 26 (Fear) | Intensifying fear |
| VIX | ~17-18 | 📈 +15%-20% |
1. 📊 Technical Analysis
BTC 4-Hour Chart Structure
BTC exhibits a clear contracting range on the 4-hour timeframe:
$66,000 ─── Resistance: Prior high + 50-month EMA $64,500-$65,200 ─── Resistance: 200-day MA + liquidity zone $64,000 ─── Near-term resistance: Round number + Polymarket 63.5% pivot ───────────────────────────────── Current: $63,700-$63,800 $63,000-$63,200 ─── Support: Repeatedly tested since July $62,500 ─── Support: 200-week MA $61,500-$62,000 ─── Support: 20-day MA + prior consolidation $60,000 ─── Iron floor: Polymarket 99.2% probability
Key Indicator Readings
| Indicator | Current | Signal |
|---|---|---|
| RSI (14-day) | ~42-45 | Neutral-bearish, not oversold (<30) |
| RSI (4-hour) | ~38-42 | Near-term weak, approaching oversold |
| MACD | Daily DIF>DEA | Divergent, short-bullish/long-bearish |
| Bollinger Bands | Price below midline | Weak but not touching lower band |
| Volume | ~$52B | Normal weekend — insufficient to confirm direction |
| Funding Rate | −0.001% to 0 | Very low, longs not crowded |
| Open Interest | −1.5% daily | Moderate deleveraging |
Symmetrical Triangle / Flag Pattern
BTC has formed a symmetrical triangle on the 4-hour chart since the July 3 bounce from $60K:
- Upper trendline: Connecting July 3 $62.5K → July 5 $63.5K → July 9 $63.3K
- Lower trendline: Connecting July 3 $60K → July 8 $62K → July 11 $62.8K
Price is approaching the triangle apex, typically indicating an imminent breakout.
Key Takeaway: BTC's $63K-$64K structure is entering a "coiling phase." Technically, $64K is the short-term bull/bear line — holding above confirms an upside breakout targeting $66K. A break below $63K risks a retest of $62K or even $60K. Breakout signals during low liquidity are less reliable — wait for Monday's US session for confirmation.
2. 🔬 On-Chain & Liquidity Analysis
Exchange Balance
| Metric | Value | Interpretation |
|---|---|---|
| BTC on Exchanges | 6.6% | Lowest since 2017 |
| Monthly Change | −4.8% | Sustained net outflows |
| Miners' Holdings | 1.816M BTC | Miners holding steady |
Exchange BTC balances at 6.6% mean sellable BTC supply is at an all-time low. This accelerating trend is a core reason BTC has established strong support in the $60K-$64K range.
Address Analysis
| Address Cohort | Recent Behavior | Signal |
|---|---|---|
| Whales (1K-10K BTC) | 🟢 Accumulating | Smart money buying |
| Mega-Whales (>10K BTC) | 🟢 Accumulating | Institutional-level buying |
| Retail (<1 BTC) | Mixed | Retail sentiment divided |
| Exchange Wallets | 🔴 Net outflows | Investors prefer self-custody |
Network Health
| Metric | Value | Trend |
|---|---|---|
| Hashrate | ~850 EH/s | Continuously growing |
| Mining Difficulty | Near ATH | Network security robust |
| Active Addresses | 780K/day | Normal levels |
| Daily Transactions | 320K/day | Normal levels |
Key Takeaway: On-chain data aligns with price action — accumulation, not distribution. Declining exchange balances, whale accumulation, and rising hashrate all suggest BTC is undervalued relative to its network strength.
3. 💰 Futures & Sentiment Analysis
Futures Market Data
| Metric | Current | Signal |
|---|---|---|
| Funding Rate | −0.001% to 0 | Neutral-slightly bearish — longs not crowded |
| Open Interest | −8% monthly | Deleveraging ongoing |
| Long/Short Ratio | 0.95-1.05 | Balanced |
| Liquidations | $115M (58,200 traders) | Longs dominated |
Options Market
| Metric | Data | Signal |
|---|---|---|
| 25% Delta Skew | Slightly negative | Put premium slightly elevated |
| Max Pain | ~$63K | Near current price |
| End-of-July OI | Concentrated $60K-$66K | Expected range |
Market Sentiment
| Metric | Data | Note |
|---|---|---|
| Fear & Greed | 26 (Fear) | Down from 31 last week |
| Social Media Sentiment | Bearish | Geopolitical risk dominates |
| Google Trends "BTC" | Low | Retail attention muted |
Key Takeaway: Futures markets show "direction undecided" — funding rates near zero, long/short ratios balanced, OI declining gently. Fear & Greed at 26 signals the market has entered "fear" territory. Historically, fear zones often represent medium-term buying opportunities. However, geopolitical uncertainty demands wider risk buffers for any "bottom fishing."
4. 🔮 Next Week Outlook
Core Variables
| Variable | Direction | Impact |
|---|---|---|
| Hormuz Strait | Standoff (base case) | Neutral-bearish |
| June CPI (Jul 14) | Core CPI +0.2% m/m expected | ⭐⭐⭐⭐⭐ |
| CLARITY Draft (next week) | Possible consolidated text | ⭐⭐⭐⭐ |
| ETF Flows | Outflows slowing | 📈 Positive |
Price Targets
| Timeframe | Target Range | Probability |
|---|---|---|
| Near-term (1-3 days) | $62,800-$64,500 | ~65% |
| Mid-term (1-2 weeks) | $60,000-$66,000 | ~80% |
| Post-CPI (Jul 14+) | $61,000-$67,000 | CPI-dependent |
Trading Strategy Reference
| Strategy | Entry | Stop | Target |
|---|---|---|---|
| Breakout Long | $64,200+ hold | $63,500 | $65,500-$66,000 |
| Buy the Dip | $62,500-$63,000 | $61,800 | $64,000-$64,500 |
| Wait and See | — | — | Wait for CPI + CLARITY |
⚠️ Risk Disclaimer: The market faces a triple overlay of uncertainty: macro (CPI), geopolitical (Hormuz), and regulatory (CLARITY). Weekend low liquidity amplifies any sudden news. This analysis is for educational purposes only and does not constitute investment advice.
Recommended: Binance Registration | OKX Registration
📖 Related Reading: