
Deep Market Analysis July 13: BTC Consolidates at $64K, 200-Week MA Confirmed for 4th Day, Whales Accumulate 270,000 BTC ($16.7B) in 2 Weeks, Loss-Making Supply Exceeds Profit-Making Supply for First Time This Cycle — Historic Bottom Signal, Triple Catalyst Week Ahead
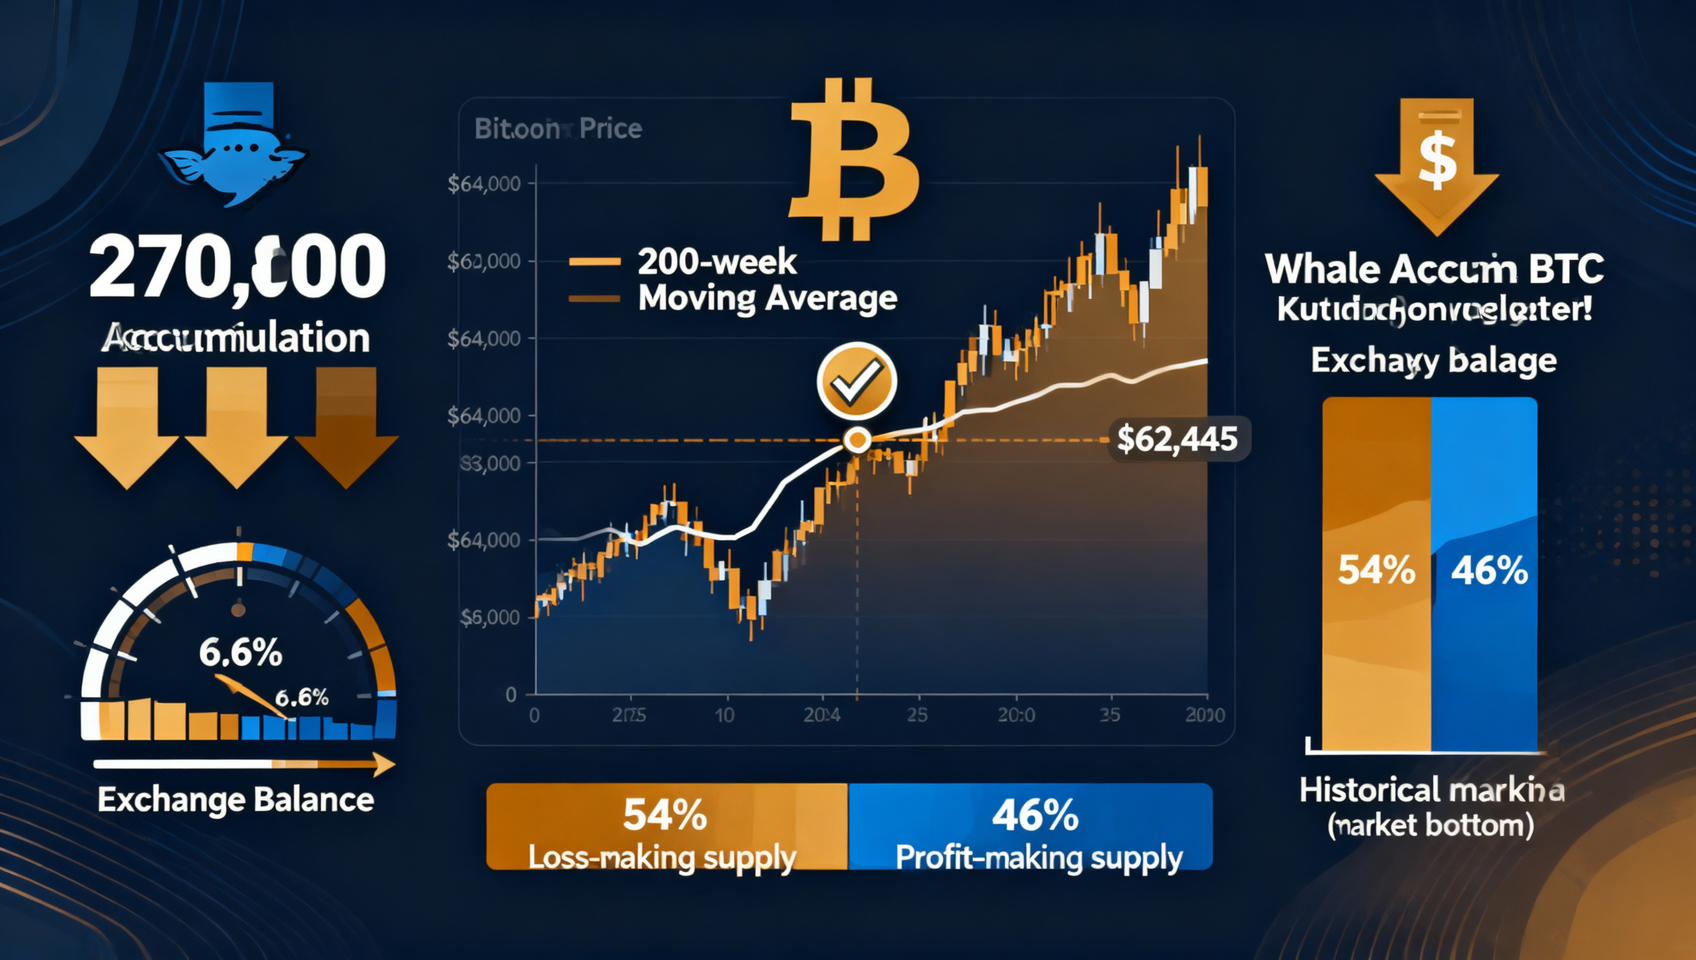
Bitcoin consolidates in a tight $63.7K-$64.2K range (flat), forming a pattern of 'resistance above, support below' at the $64K level. The 200-week MA ($62,445) has been confirmed for the 4th consecutive day — the most important medium-term bullish signal. On-chain data reveals whales accumulated 270,000 BTC ($16.7B) in the past two weeks, dwarfing combined ETF outflows and Strategy sales. BTC's loss-making supply (54%) has exceeded profit-making supply for the first time this cycle — a classic historical bottom signal that preceded 90%-500% rallies in prior cycles. Exchange balance falls to 6.6% — a 7-year low. CLARITY Act odds at 40% constitute the main structural headwind. CPI data, CLARITY hearings, and the FOMC decision form a triple catalyst this week.
Market Overview
| Metric | Value | 24h Change |
|---|---|---|
| Total Market Cap | ~$2.15T | ➡️ Flat |
| BTC Price | $63,700-$64,200 | 📉 -0.3%~-0.5% |
| ETH Price | $1,804-$1,822 | 📈 +1.07% |
| SOL Price | ~$77.15 | 📈 +0.90% |
| XRP Price | ~$1.08 | 📉 -2.3% |
| BNB Price | ~$573 | 📉 -1.1% |
| BTC Dominance | ~58.43% | New 2026 high |
| Fear & Greed | 26 (Extreme Fear) | Fell from 31 |
| 24h Volume | ~$42B | Low weekend level |
| VIX | ~16.5 | Slight uptick |
| 10Y Treasury | ~4.42% | Unchanged |
| DXY | ~100.8 | Slight strengthening |
1. BTC Technical Analysis: 'Resistance Above, Support Below' at $64K
Current Price Action
BTC is trading at $63,700-$64,200 on July 13, essentially flat in 24 hours, forming a narrow consolidation range around the $64,000 psychological level.
| Dimension | Detail |
|---|---|
| July Low | $57,950 (July 1, 21-month low) |
| Current | $63,700-$64,200 |
| Rally Magnitude | ~9.9%-10.8% |
| Rally Duration | 13 days |
| Intraday High (this week) | ~$64,524 (July 10) |
| Intraday Low (this weekend) | ~$63,650 |
| 24h Volume | ~$42B (low weekend) |
Technical Indicators
RSI
- 14-day RSI: ~44-46 — slight decline from ~48 mid-week, but still above the July 1 low of ~25
- Key observation: RSI failing to break above 50 is a short-term weakness signal
MACD
- Daily MACD: Fast line still above slow line but narrowing — momentum slowing
- MACD Histogram: Above zero but shrinking — bullish momentum fading
- Overall: Neutral-bearish, direction window closing
Moving Averages
| MA | Level | Status | Significance |
|---|---|---|---|
| 20-day MA | ~$62,200 | ✅ Above | Short-term support holds |
| 200-week MA | $62,445 | ✅ Day 4 confirmed | Medium-term bullish signal CONFIRMED |
| 50-day MA | ~$67,600 | ❌ Below | Medium-term resistance (descending) |
| 200-day MA | ~$73,500 | ❌ Below | Long-term resistance |
| 50-month EMA | ~$65,500 | ❌ Below | Trend reversal confirmation level |
200-week MA ($62,445) Update: Day 4 of consecutive daily closes above this critical level — the 3-day confirmation threshold has been met. This is the most important medium-term bullish signal currently active.
| Day | Date | Daily Close | vs 200-week MA |
|---|---|---|---|
| Day 0 | July 9 (Wed) | ~$61,500 | ❌ Lost |
| Day 1 | July 10 (Thu) | ~$63,000 | ✅ Reclaimed |
| Day 2 | July 11 (Fri) | ~$64,000 | ✅ Confirming |
| Day 3 | July 12 (Sat) | ~$63,800 | ✅ Confirmed |
| Day 4 | July 13 (Sun) | ~$63,800 | ✅ Sustained |
Key Levels
| Level | Price | Significance |
|---|---|---|
| Resistance 3 | $70,000-$74,000 | Psychological + 200-day MA |
| Resistance 2 | $66,000-$67,000 | 50-month EMA + options zone |
| Resistance 1 | $64,500-$65,200 | Near-term resistance |
| Current | $63,700-$64,200 | $64K battleground |
| Support 1 | $62,445-$63,000 | 200-week MA (core support) |
| Support 2 | $61,000-$62,000 | 20-day MA + July 9 low |
| Support 3 | $60,000 | Last defense for bulls |
Scenario Probabilities (July 13 Update)
| Scenario | Prob | BTC Target | Trigger |
|---|---|---|---|
| 📈 Break $65K toward $66K-$68K | ~30% | $65K-$68K | CPI below expectations + CLARITY hearing positive + ETF inflows resume + Strategy stops selling |
| ➡️ $63K-$65K range awaiting catalysts | ~50% | Range-bound | CPI in line + CLARITY progresses but doesn't pass + geopolitics stalemate |
| 📉 Rejected, pullback to $62K-$63K | ~20% | $61K-$63K | CPI above expectations + CLARITY delayed again + Strategy sells more + US-Iran full escalation |
Change from July 11: "Range" probability raised from 45% to 50% (weekend confirmed $64K breakout not yet complete), "Breakout" stays at 30% but target raised from $64K-$67K to $65K-$68K (200-week MA confirmed provides stronger base), "Pullback" lowered from 25% to 20% (weekend selling limited, pressure not as strong as expected).
2. Altcoin Analysis
Top 10 by Market Cap
| Rank | Coin | Price | 24h Change | 7d Change |
|---|---|---|---|---|
| 1 | BTC | $63,700-$64,200 | -0.3%~-0.5% | +9.9% |
| 2 | ETH | $1,804-$1,822 | +1.07% | ~+11% |
| 4 | BNB | ~$573 | -1.1% | +4% |
| 6 | XRP | ~$1.08 | -2.3% | +5% |
| 7 | SOL | ~$77.15 | +0.90% | +6% |
| 10 | DOGE | ~$0.073 | -0.2% | +3% |
Ethereum (ETH) — Relative Strength, $1,804-$1,822
ETH leads the top 10 with +1.07% today. ETH/BTC recovered to 0.02855.
Key drivers:
- ETH ETF inflows ($84.4M last week, Fidelity FETH $69.2M single-day)
- WebX 2026 Tokyo — Japan's largest Web3 conference
- Robinhood L2 launch — new users and liquidity to ETH ecosystem
Technical levels:
- Resistance: $1,800-$1,806 (50-day EMA) — currently testing, needs close confirmation
- Next resistance: $1,850-$1,900 (near 100-day EMA)
- Support: $1,700 (psychological) + $1,680 (recent low)
BNB — Slight Pullback, ~$573
BNB at ~$573 (-1.1%), short-term support at $570-$580 remains intact.
XRP — Worst Performer, ~$1.08
XRP -2.3% today, hardest hit by CLARITY Act stall news — token classification is XRP's most important regulatory catalyst.
SOL — Small Gain, ~$77.15
SOL +0.90%, benefiting from WebX 2026 sentiment.
3. Macro Environment Analysis
🟢 Bullish Factors
1. Whale Accumulation — $16.7B Hidden Buying
Whales (1K-10K BTC addresses) accumulated 270,000 BTC (~$16.7B) in the past two weeks — the single most important hidden demand driver in the market.
2. ETF Outflow Streak Broken
BTC and ETH ETFs broke the 8-week outflow streak with a combined $282M inflow last week. While still "repair flows" relative to >$5B accumulated outflows, the directional change is positive.
3. Exchange Balance at 7-Year Low
BTC exchange balance at 6.6% (~1.29M BTC), continuing to set new cycle lows. Supply scarcity escalating.
🔴 Bearish Factors
1. CLARITY Act Stalled — Structural Headwind
Polymarket odds at 40% mean regulatory clarity expectations are fading, suppressing institutional appetite.
2. US-Iran Escalation — Oil Above $78
Brent crude at $78.40. Sustained oil above $80 would significantly increase Fed rate pressure.
3. Fear & Greed at 26
Deteriorated from 31 last week back to "Extreme Fear."
4. Stablecoin Supply Contraction
June stablecoin supply contracted 2.4% (-$7.7B) — largest monthly decline since Terra collapse. Limits dip-buying capacity.
4. On-Chain Data Deep Dive
Core Metrics
| Metric | Value | Status | Trend |
|---|---|---|---|
| NUPL | ~0.07 (mild anxiety) | Stabilized after recovery | 📈 Bottom signal strengthening |
| Supply in Profit | ~46% | Loss-making supply (54%) exceeds profit for first time this cycle | ⚠️ Historic bottom feature |
| Exchange Balance | 6.6% | Continuously declining, 7-year low | 📈 Supply scarcity extreme |
| Exchange Balance (BTC) | ~1,290,000 BTC | Lowest since 2017 | 📈 Extremely scarce |
| Short-term Holders Underwater | ~15% | Avg cost $74.9K — gap narrowing | ➡️ Selling pressure easing |
| Funding Rate | ~0 (neutral) | Stable after recovery | ✅ Normal |
| Network Hashrate | All-time high | Continuously growing | 🟢 Network security |
Key Interpretation
1. Loss-Making Supply Exceeds Profit Supply — Historic Bottom Signal
Glassnode data shows 10.83M BTC in loss vs. 9.22M BTC in profit (54% vs. 46%) — the first time loss-making supply has exceeded profit-making supply this cycle.
| Cycle | Loss-Making Supply | Next 12-Month Return |
|---|---|---|
| Dec 2018 | ~55% | +90% |
| Mar 2020 | ~52% | +500% |
| Nov 2022 | ~58% | +150% |
| Jul 2026 | ~54% | ? |
2. Whale Accumulation — $16.7B in 'Hidden Buying'
1K-10K BTC addresses net accumulated +47,830 BTC in two weeks. The entire 100-10K BTC cohort accumulated +270,000 BTC (~$16.7B).
Whale Accumulation vs ETF Outflows:
| Flow | Direction | Size | Period |
|---|---|---|---|
| BTC ETF net outflows (H1 2026) | ❌ Selling | ~$5.4B | Jan-Jun 2026 |
| Whale accumulation | ✅ Buying | ~$16.7B | Late June-Early July |
| Strategy sale | ❌ Selling | $216M | June 29-July 5 |
The net effect: strong hands (whales) absorbing weak hands' (ETF redeemers, Strategy) sold supply.
3. Exchange Balance at 6.6% — Available Supply Extremely Scarce
At 6.6%, the BTC exchange balance ratio is the lowest since 2017:
- 2017 low (~12%) → bull run to $19,000+
- March 2020 (~13%) → bull run to $69,000
- July 2026 (6.6%) → Lowest on record
Derivatives Market
| Metric | Value | Status | Interpretation |
|---|---|---|---|
| BTC Perp Funding Rate | ~0 (neutral) | ✅ Normal | Balanced longs/shorts, no excessive leverage |
| Quarterly Basis (annualized) | ~4.0% | 🟡 Below healthy | Longing appetite weak |
| Options Implied Volatility | ~55% | Down from 70%+ | Fear premium largely cleared |
| Polymarket $60K | 95.7% | ✅ | Strong confidence in $60K support |
| Polymarket $64K | ~46% | ➡️ | $64K is the pivot point |
5. Outlook and Trading Strategy
This Week's Event Calendar
| Date | Event | Impact | BTC Direction |
|---|---|---|---|
| Mid-week | 🔥🔥🔥 CLARITY Act Senate Hearing | ⭐⭐⭐⭐⭐ | Regulatory direction |
| This week | 🔥🔥🔥 June CPI Data Window | ⭐⭐⭐⭐⭐ | Macro catalyst |
| Before July 23 | 🔥🔥 US-Iran Talks Progress | ⭐⭐⭐ | Geopolitical premium |
| July 28-29 | 🔥🔥🔥 FOMC July Rate Decision | ⭐⭐⭐⭐⭐ | Medium-term direction |
| July 30 | 🔥🔥 Strategy Q2 Earnings | ⭐⭐⭐ | BTC strategy update |
Three Scenario Trading Strategies
Scenario 1: $63K-$65K Range Awaiting Catalysts (~50% probability)
BTC oscillates in $63,000-$65,000 range with normalizing volume, awaiting CPI and CLARITY catalysts.
Strategy: Light long at $63,000-$63,500 (stop $62,000). Reduce at $64,500-$65,000. Keep position <50%. Add on volume break of $64,500.
Scenario 2: CPI Positive + CLARITY Progress + BTC Breaks $65K (~30% probability)
June CPI below expectations, CLARITY hearing positive, BTC breaks $65K with volume toward $66K-$68K.
Confirmation signals:
- CPI below expectations (core <3.0% = bullish)
- CLARITY Act hearing shows forward progress (not another delay)
- BTC breaks $64,500 with volume
- BTC Dominance starts declining (capital flowing to altcoins)
Strategy: Add to 50%-70% position. Target $66,000-$68,000.
Scenario 3: CPI Negative + CLARITY Stalls + BTC Retests $62K (~20% probability)
CPI above expectations, CLARITY further delayed, BTC retests $62,000-$63,000 support.
Strategy: Reduce to <30% before CPI. If BTC holds $62,000 and the 200-week MA, consider light long. If $62K breaks, don't buy the dip — $60K is next support.
Key Indicators Tracker
| Indicator | Start (Jul 11) | Current (Jul 13) | Trend | Signal |
|---|---|---|---|---|
| BTC Price | $63,800-$64,140 | $63,700-$64,200 | ➡️ Flat | 🟡 |
| 200-week MA | ✅ Reclaimed | ✅ Day 4 confirmed | 📈 Sustained | 🟢 |
| RSI (14d) | ~45-48 | ~44-46 | 📉 Slight decline | 🟡 |
| Funding Rate | ~0 | ~0 | ➡️ Normal | 🟢 |
| Fear & Greed | 31 (Fear) | 26 (Extreme Fear) | 📉 Deteriorated | 🔴 |
| BTC Dominance | ~58.4% | ~58.43% | 📈 Still rising | 🟢 |
| ETH/BTC | ~0.0281 | ~0.0286 | 📈 ETH strengthening | 🟢 |
| VIX | 15.03 | ~16.5 | 📈 Slight uptick | 🟡 |
| DXY | ~100.32 | ~100.8 | ➡️ Flat | 🟡 |
Overall Assessment
As of July 13 (Sunday), BTC presents a clear "support below, resistance above" structure:
Bottom signals (support below):
- ✅ 200-week MA ($62,445) confirmed for 4th consecutive day
- ✅ 20-day MA (~$62,200) reclaimed — short-term support effective
- ✅ Exchange balance at 6.6% — supply scarcity extreme
- ✅ Whales accumulated 270,000 BTC — strong on-chain demand
Topside pressure (resistance above):
- ❌ 50-day MA ($67,600) and 50-month EMA ($65,500) still descending
- ❌ CLARITY Act stalled at 40% probability
- ❌ Fear & Greed at 26 — market confidence low
- ❌ Stablecoin supply contracting — limits rally buying power
One-week outlook:
The weekend's low-volume consolidation at $63.7K-$64.2K places the market at a decision crossroads. Technical bottom structure (200-week MA confirmed, exchange balance at 7-year low) and fundamental headwinds (CLARITY Act stalled, US-Iran escalation) are forming a tense standoff.
This week's CPI data and CLARITY Act hearing are the catalysts that will break the deadlock. If both deliver positive signals, BTC could see a breakout to $65K-$68K. If both disappoint, a retest of $60K-$62K is possible.
The appropriate positioning is flexible: not overly bearish or bullish, position <50%, waiting for catalyst clarity.
⚠️ Risk Disclaimer: This analysis is for informational purposes only. Cryptocurrency investment carries high risk. Always manage your risk carefully.
Getting Started: Binance | OKX
📚 Learning Resource: On-Chain Guide - Blockchain from Zero
Related: