
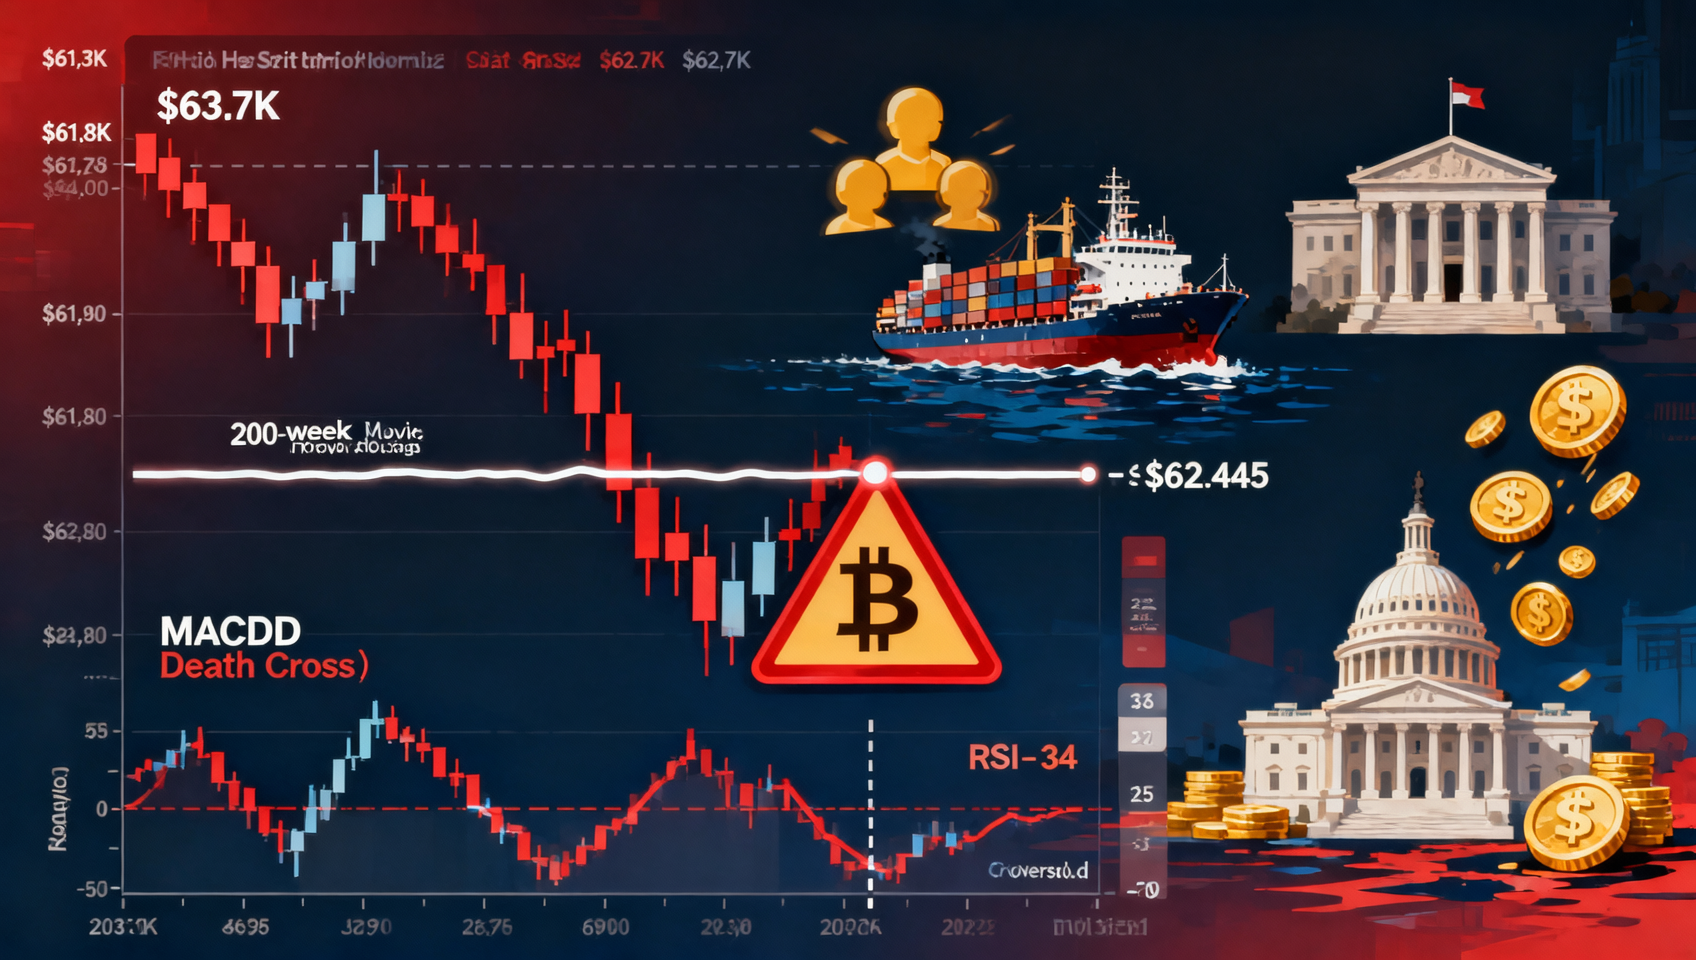
Crypto Market Analysis July 14, 2026: BTC Breaks $62K Under Triple Headwinds — 200-Week MA at Risk, Panic Selling Exhaustion Suggests Bottom, June CPI Cools but Core Sticky
Bitcoin fell to $61,847-$62,730 (−2.7% to −3.1%), losing $62K. The 200-week MA is under renewed threat. Trump 20% Hormuz toll, Waller rate hike warning, US gov $297M transfer. Daily spot selling plunged from 2,000 BTC (June) to 53 BTC (July). Coinbase says BTC may be bottoming. CPI -0.1% but core +0.2%. Fear & Greed at 22.
Market Overview
| Metric | Value | 24h Change |
|---|---|---|
| Total Market Cap | ~$2.13T | 📉 −2.5% |
| BTC Price | $61,847-$62,730 | 📉 −2.7%~−3.1% |
| ETH Price | $1,755-$1,780 | 📉 −2.0%~−2.7% |
| SOL Price | ~$74.60 | 📉 −2.7% |
| XRP Price | ~$1.06 | 📉 −2.0% |
| BNB Price | ~$565 | 📉 −1.4% |
| BTC Dominance | 58.15% | ➡️ Flat |
| Fear & Greed | 22 (Extreme Fear) | Down from 26 |
| 24h Liquidations | ~$252M (83% longs) | Heavy long pressure |
| VIX | ~18-19 | Panic rising |
| DXY | 101.25 | Dollar strengthens |
I. BTC Technical Analysis: Triple Headwinds Drive Broad Sell-off
Today's Price Action Timeline
| Time | Event | BTC Reaction |
|---|---|---|
| Asia morning | Trump announces 20% Hormuz toll + naval blockade | $63.5K→$62.5K |
| Pre-US | US gov transfers $297M to Coinbase Prime | $62.5K→$62.2K |
| US pre-market | Fidelity FBTC $245.6M outflow | Further pressure |
| US session | Waller hawkish speech + CPI digestion | $62K→$61,847 (low) |
| Late US | Buyers step in | Recovered to ~$62,200 |
Technical Indicators
RSI
- 14-day RSI: ~34-36 — approaching oversold territory (<30)
- Down from 43-45 last week — momentum sharply turning bearish
MACD
- Daily MACD death cross confirmed — DIF crossed below DEA
- MACD histogram below zero and expanding — bearish momentum increasing
- This is a clear technical sell signal
Moving Averages
| MA | Level | Status | Significance |
|---|---|---|---|
| EMA20 | ~$62,200 | ⚠️ Losing | Short-term trend turning bearish |
| 200-week MA | $62,445 | ⚠️ Under threat | BTC briefly broke below today |
| EMA50 | ~$67,600 | ❌ Below | Medium-term resistance descending |
| 50-month EMA | ~$65,500 | ❌ Below | Trend reversal confirmation level |
200-week MA ($62,445) update: After 4 consecutive days of confirmed support, today the 200-week MA was briefly breached under triple headwinds. BTC currently around $62,200 — the 200-week MA is at its most critical battle point since early July.
Volume Analysis
- Today's volume estimated at ~$620-690B — significantly higher than weekend's $420B — sell-off on volume
- Volume sell-off + MACD death cross = classic bearish technical combination
- However, bids stepped in at $61,800-$62,000 (late recovery to $62,200) — suggesting accumulation
Key Levels
| Level | Price | Significance |
|---|---|---|
| Resistance 3 | $70,000-$74,000 | Psychological + 200-day MA |
| Resistance 2 | $66,000-$67,000 | 50-month EMA + options concentration |
| Resistance 1 | $64,500-$65,200 | Prior resistance |
| Above | $63,000-$63,500 | 20-day EMA (lost) |
| Current | $61,847-$62,730 | Below $62K |
| Support 1 | $61,300-$61,500 | Near July 1 low |
| Support 2 | $60,000 | Polymarket 96.8% — bull's last line |
| Support 3 | $57,950 | 21-month low (July 1) |
Scenario Probabilities (July 14 Update)
| Scenario | Prob | BTC Target | Trigger |
|---|---|---|---|
| 📈 Bottom-bounce from $61K-$62K | ~30% | $63K-$64K | Marginal seller exhaustion + continued whale accumulation + neutral Warsh |
| ➡️ $60K-$62K consolidation | ~45% | Range-bound | Geopolitical standoff continues, awaiting FOMC |
| 📉 Break $60K to $57K-$59K | ~25% | $57K-$59K | Hormuz worsens + hawkish FOMC + ETF outflows resume |
 |
|||
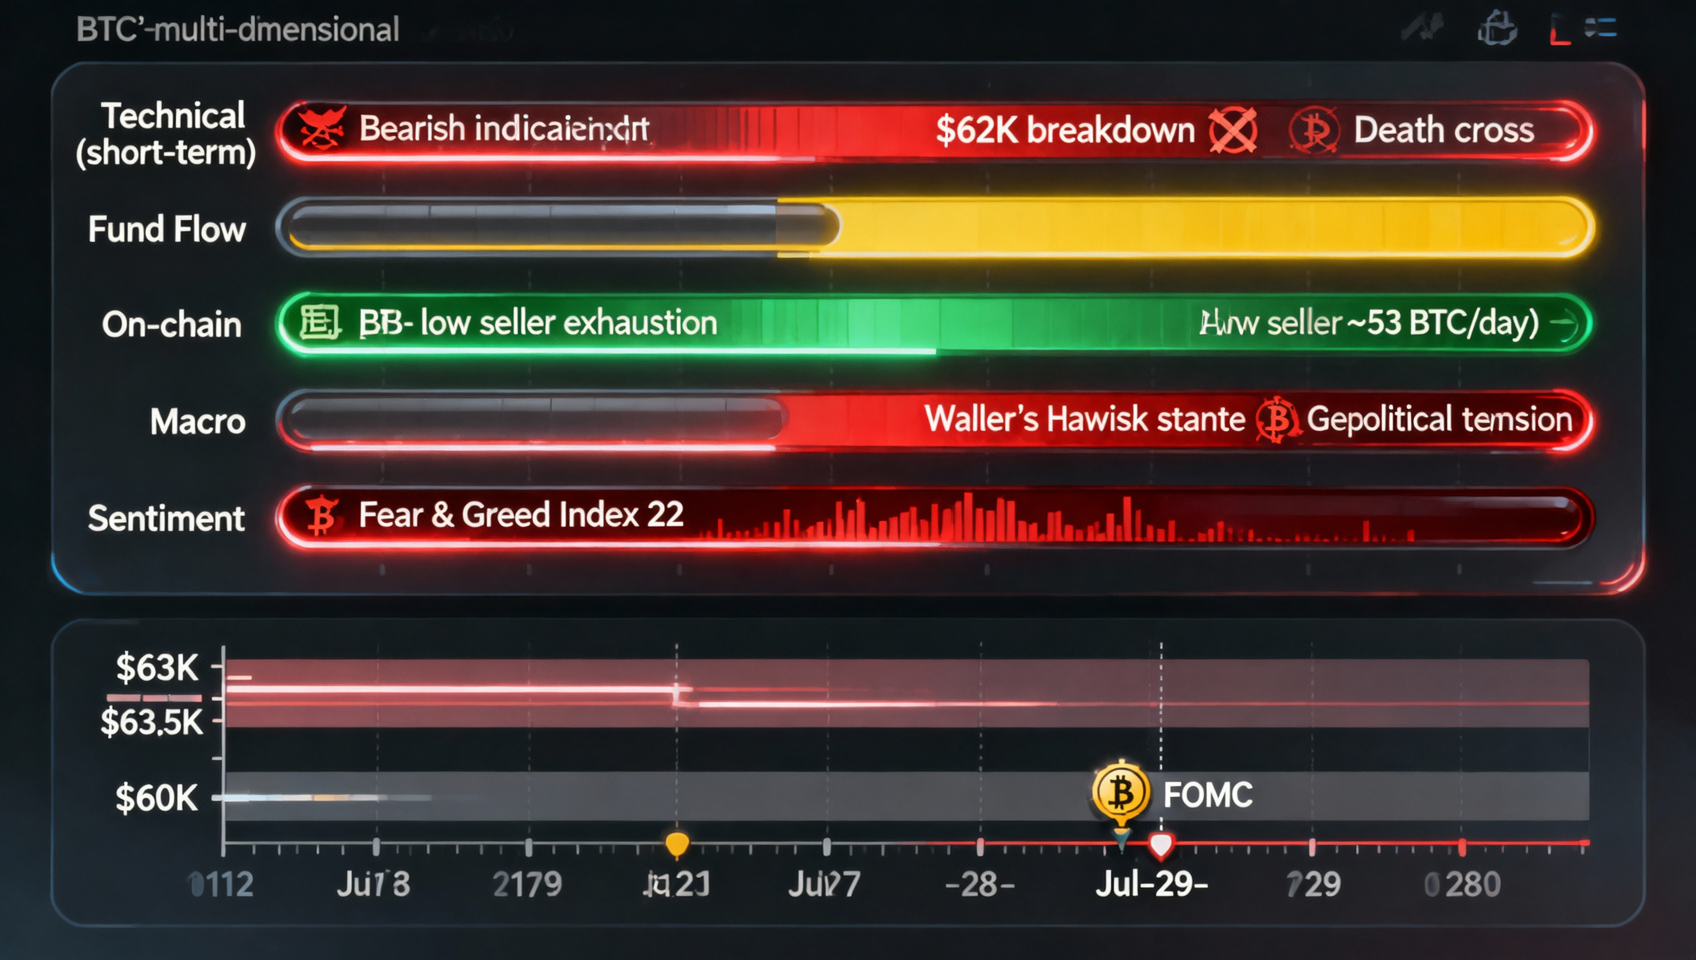
| BTC technical analysis: triple headwinds, 200-week MA test, MACD death cross, RSI near oversold 36; triple headwind sources: Trump 20% Hormuz toll (geo), Waller rate hike warning (macro), US Gov $297M + Fidelity $245.6M outflow (token supply) |
II. Altcoin Analysis
| Rank | Coin | Price | 24h | Note |
|---|---|---|---|---|
| 1 | BTC | $61.8K-$62.7K | −2.7%~−3.1% | $62K battle, 200-week MA tested |
| 2 | ETH | $1,755-$1,780 | −2.0%~−2.7% | Less severe than BTC |
| 4 | BNB | ~$565 | −1.4% | Best performer |
| 6 | XRP | ~$1.06 | −2.0% | Moderate decline |
| 7 | SOL | ~$74.60 | −2.7% | In line with BTC |
III. Macro Environment
🟢 Potential Positives
1. Panic selling exhaustion — Daily spot selling from 2,000 BTC (June) to 53 BTC (July). Historically precedes bottoms.
2. Coinbase Institutional calls bottom — "BTC relative resilience may indicate bottoming process."
3. Exchange balances at 6.6% — 7-year low, supply scarcity provides structural support.
🔴 Headwinds
1. Trump's 20% Hormuz toll — unprecedented, oil +10%, global risk-off.
2. Waller rate hike warning — July hike odds at 45%, dollar strengthening.
3. US gov $297M transfer — largest batch since Aug 2024, psychological pressure.
4. Kimchi Premium negative — −0.395%, historically leading further downside.
5. Fear & Greed 22 — Extreme Fear territory.
Overall Assessment
| Dimension | Score | Trend |
|---|---|---|
| Technical (short) | 🔴 Bearish | $62K lost, death cross, 200-week MA at risk |
| Fund flows | 🟡 Neutral | ETF inflows last week but FBTC outflows today |
| On-chain | 🟢 Positive | Marginal seller exhaustion, exchange balance at 7-year low |
| Macro | 🔴 Bearish | Waller hawkish, geopolitical conflict, core CPI sticky |
| Sentiment | 🔴 Extreme Fear | Fear Index at 22 |
IV. On-Chain Data Deep Dive
Key Metrics
| Metric | Value | Status | Trend |
|---|---|---|---|
| NUPL | ~0.04 (Despair) | Falling from 0.07 | 📉 Worsening |
| Supply in Loss | ~54% | Still > profit supply | ➡️ Historical bottom feature |
| Exchange Balance | 6.6% | 7-year low, declining | 📈 Supply scarcity |
| Funding Rate | −0.005%~0 | Slightly negative | 📉 Long sentiment weakening |
| Open Interest | −5% MoM | Moderate deleveraging | 🟡 Risk reduction |
| Hashrate | All-time high | Growing | 🟢 Network security |
Key Interpretation
1. Marginal seller exhaustion — most important signal
| Period | Daily Net Selling | Market State |
|---|---|---|
| May | ~500 BTC/day | Normal profit-taking |
| Early June | ~800 BTC/day | Early panic |
| Mid-June | ~2,000 BTC/day | Panic peak ($75K→$58K) |
| Late June | ~1,200 BTC/day | Panic slowing |
| July YTD | ~53 BTC/day | Panic ending? |
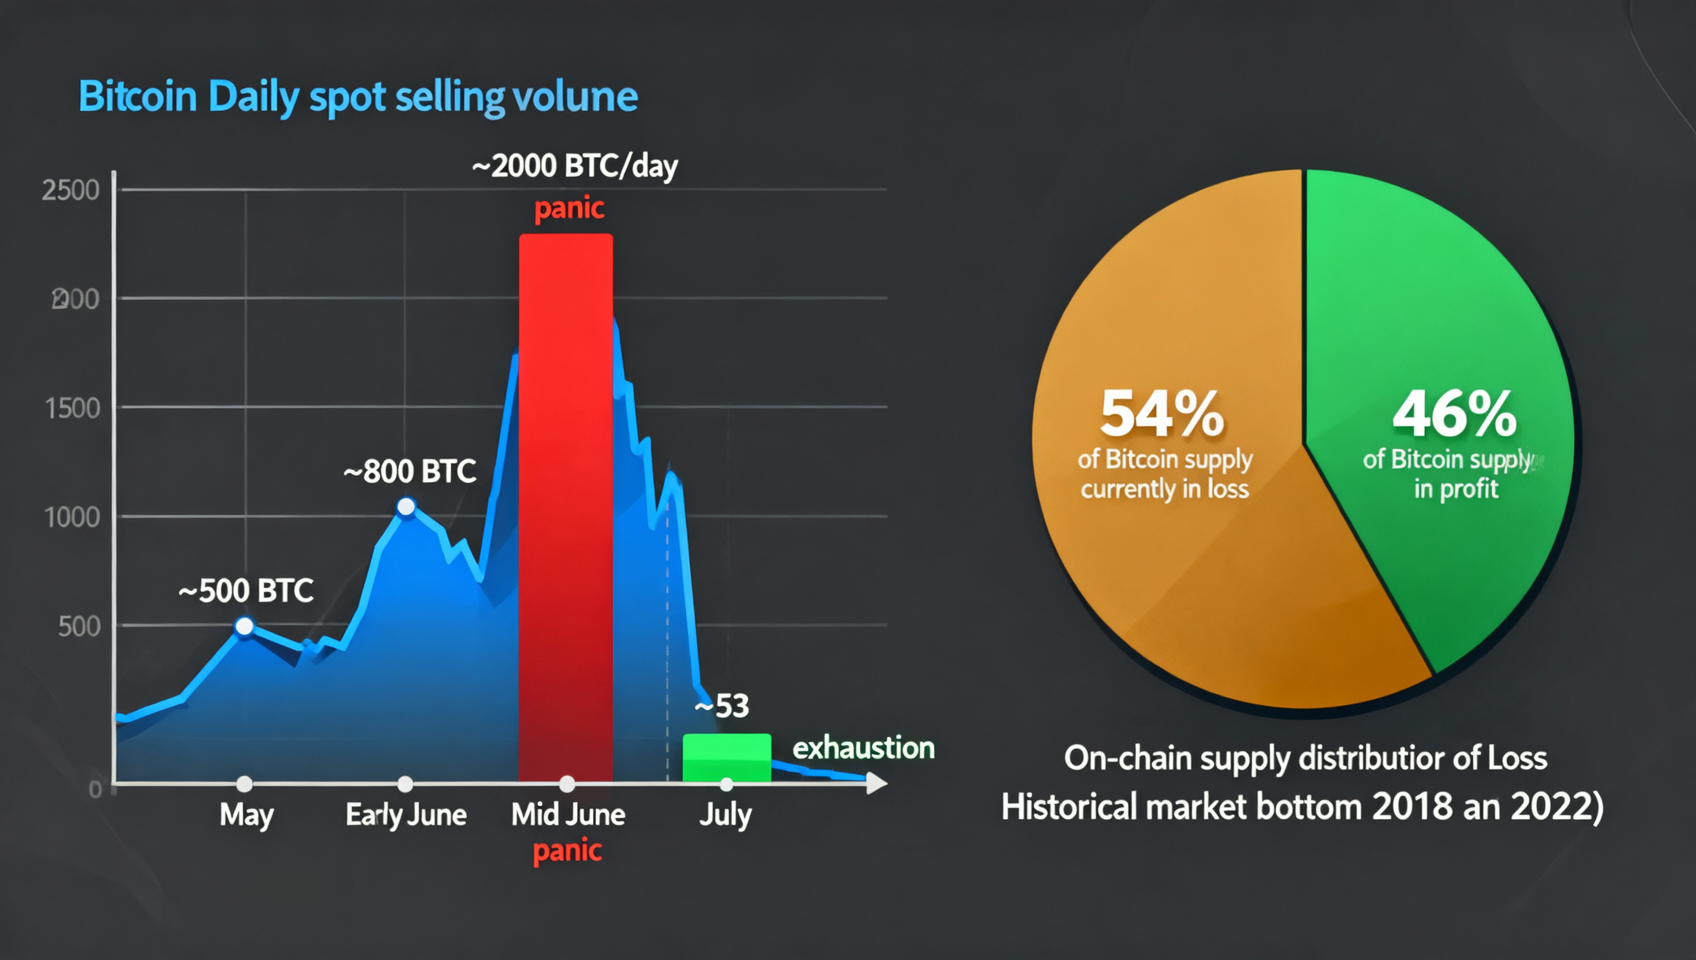 Daily spot selling collapsed from 2,000 BTC (June) to 53 BTC (July); historical: May ~500, early June ~800, mid-June ~2,000 panic peak, late June ~1,200, July ~53; 54% supply in loss vs 46% profit matching 2018/2022 bottom patterns
2. Supply in Loss 54% — historical bottom feature. Consistent with 2018, March 2020, Nov 2022 cycle bottoms.
3. Exchange Balance 6.6% — structural supply scarcity. Declining from ~13% (end 2024) — 18-month trend. Explains why BTC fell only −2.7% under triple headwinds vs −12% in June.
Derivatives
| Metric | Value | Status |
|---|---|---|
| Funding rate | −0.005%~0 | 🟡 Slightly negative |
| Quarterly basis | ~3.5% pa | 🟡 Below healthy range |
| Option IV | ~60% | Up from 55% |
| Polymarket $60K | 96.8% | ✅ Strong confidence |
| Polymarket $62K | 81.5% | ➡️ Reasonable |
| Polymarket $64K | 36.5% | 📉 Down from 46% |
V. Outlook & Strategy
Event Calendar
| Date | Event | Impact |
|---|---|---|
| Jul 14-15 | Warsh Senate testimony | ⭐⭐⭐⭐ |
| Jul 17 | BTC options expiry | ⭐⭐⭐ |
| Jul 23 | US-Iran talks | ⭐⭐⭐⭐⭐ |
| Jul 28-29 | FOMC decision | ⭐⭐⭐⭐⭐ |
| Jul 30 | Strategy Q2 earnings | ⭐⭐⭐ |
Scenario Strategies
Scenario 1: $60K-$62K bottom consolidation (45% prob)
- Accumulate in $60K-$61K range, stop at $59K
- 40% allocation max
- Trim at $62.5K-$63K
Scenario 2: Triple headwind digestion → bounce to $63K+ (30% prob)
- Entry signal: BTC volume-breaks above $62,800 (200-week MA + EMA20)
- Add to 50-60%, target $63.5K-$64K
Scenario 3: $60K breaks → $57K-$59K test (25% prob)
- $60K is critical — if broken, do NOT buy the dip immediately
- Wait for stabilization at $57.5K-$59K
Key Metrics Tracker
| Metric | Jul 11 | Jul 14 | Trend | Signal |
|---|---|---|---|---|
| BTC | $63.8K-$64.1K | $61.8K-$62.7K | 📉 Sharp drop | 🔴 |
| 200-week MA | ✅ Confirmed | ⚠️ Testing | 📉 At risk | 🟡 |
| RSI (14d) | ~45-48 | ~34-36 | 📉 Near oversold | 🟡 |
| MACD | Bullish | Death cross | 📉 Bearish | 🔴 |
| Funding rate | ~0 | −0.005%~0 | 📉 Negative | 🟡 |
| Fear & Greed | 31 | 22 (Extreme Fear) | 📉 Worsening | 🔴 |
| DXY | ~100.8 | 101.25 | 📈 USD strong | 🔴 |
Summary
July 14 — "Triple Headwind Tuesday." Three qualitatively different bearish catalysts struck simultaneously: geopolitical (Trump's 20% Hormuz toll), macro (Waller rate hike warning), and crypto-internal (US gov transfer + FBTC outflow).
Bearish technical signals: $62K lost, MACD death cross confirmed, 200-week MA under renewed threat.
Bullish structural signals: Marginal seller exhaustion (53 BTC/day), exchange balances at 7-year low, whale accumulation ongoing, Coinbase Institutional calling a bottom.
Conclusion: Near-term bias is bearish, $60K-$61K critical defense. But panic exhaustion suggests downside is likely limited. Maintain defensive position (30-40%).
⚠️ Disclaimer: This analysis is for informational purposes only and does not constitute investment advice.
Recommended: Binance Registration | OKX Registration
📚 Further Reading: On-Chain Guide - Blockchain from Zero
📖 Related: