
Deep Market Analysis July 16: BTC Consolidates at $64K-$65K After CPI+PPI Double Miss — PPI 5.5% Below Expectations Sends July Rate Hike Odds to 12%, 50-Month EMA at $65,300 Unbroken, ETH Leads at $1,920-$1,928 (43-Day High), CLARITY Act Hearing Tomorrow Becomes Key Catalyst
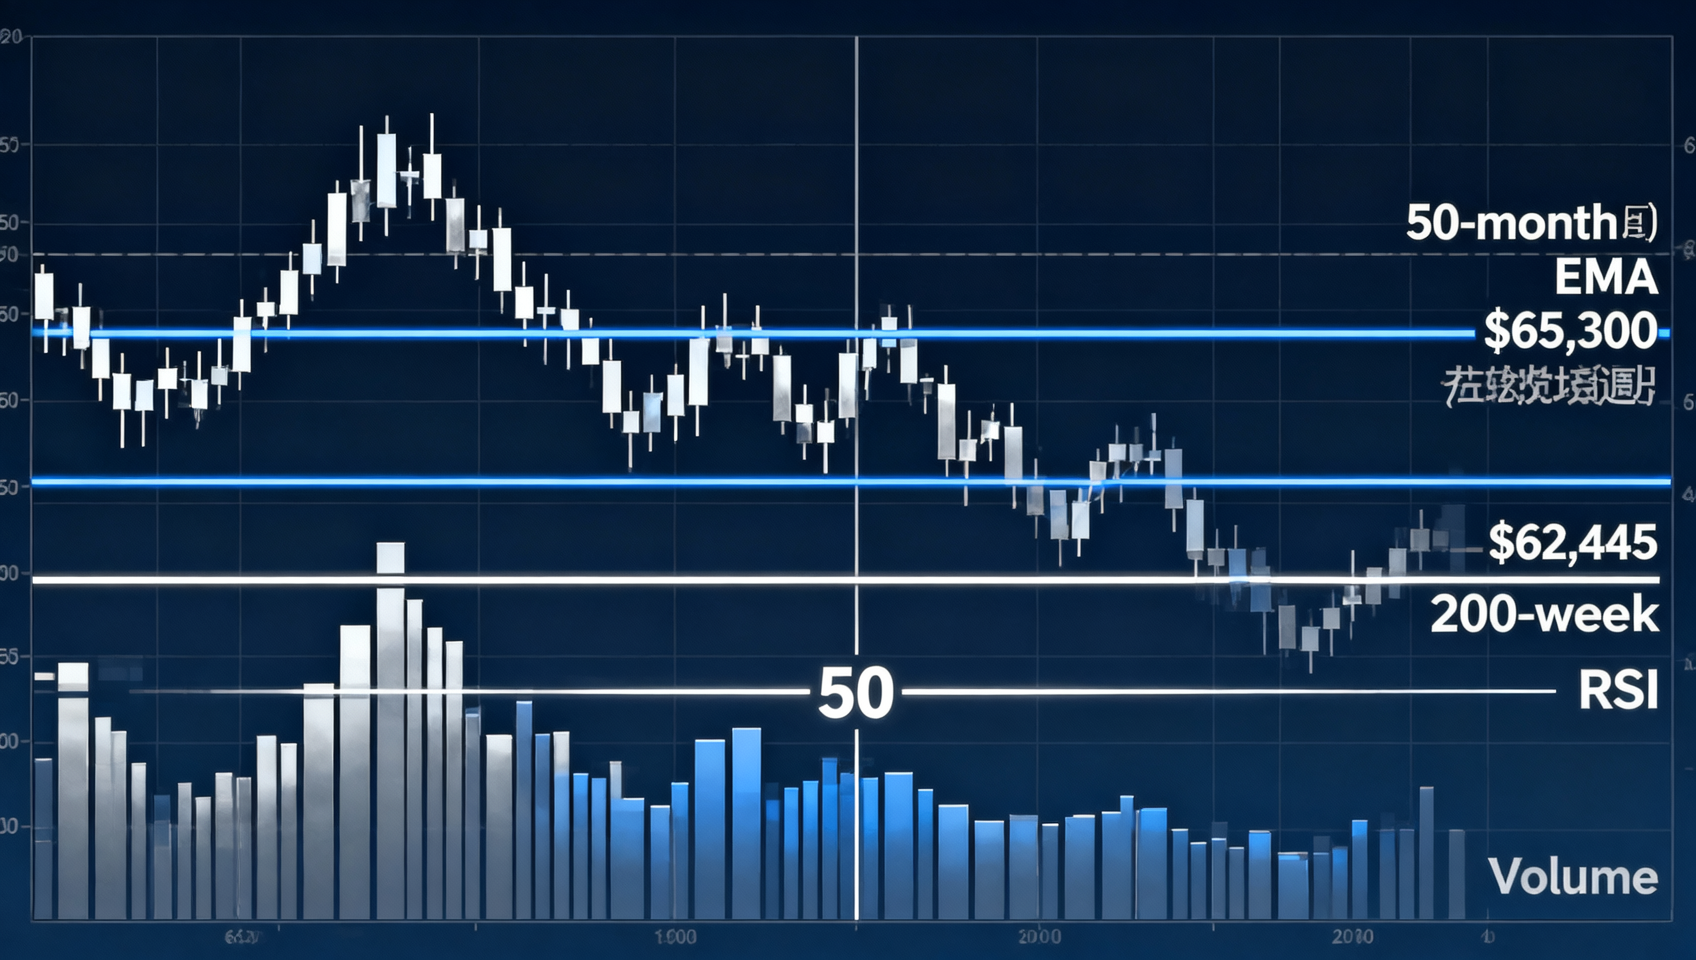
Bitcoin consolidates in the $64,800-$65,100 range today as the dual CPI+PPI tailwinds are fully priced in and upward momentum weakens. June PPI came in at 5.5% YoY (est. 6.2%) with a -0.3% MoM decline — the steepest in 14 months — sending July FOMC rate hike odds from 31% to just 12%. After a ~12% rally from the July 1 low of $57,950, BTC failed to break through the 50-month EMA ($65,300) as profit-taking emerged. RSI hovers around 50, momentum fading. The 200-week MA ($62,445) has been held for 7 consecutive days. ETH is outperforming at $1,920-$1,928 — a 43-day high — with ETH/BTC recovering above 0.0295. The CLARITY Act NYC field hearing on July 17 is the key short-term catalyst. Exchange balance falls to 6.45% — a new all-time low. Fear & Greed Index at 23-25 (Extreme Fear).
Market Overview
| Metric | Value | 24h Change |
|---|---|---|
| Total Market Cap | ~$2.31T | 📈 +1.0% |
| BTC Price | $64,800-$65,100 | 📈 +0.14%~+1% |
| ETH Price | $1,920-$1,928 | 📈 +2.0%~+2.45% |
| SOL Price | ~$77.40 | 📉 -0.3% |
| XRP Price | ~$1.11 | 📈 +0.3%~+0.6% |
| BNB Price | ~$581 | 📈 +0.5% |
| ADA Price | ~$0.187 | 📈 +2.5% |
| BTC Dominance | ~57.6% | 📉 Slight decline (capital rotating to ETH ecosystem) |
| Fear & Greed | 23-25 (Extreme Fear) | Up slightly from 22 last week |
| 24h Volume | ~$55B | Down from $65B CPI peak — normal consolidation |
| VIX | ~17.2 | Slightly up (US-Iran conflict) |
| DXY | ~99.7 | 📉 -0.2% (maintaining weakness) |
| Brent Crude | $84.95 | 📈 Geopolitical premium |
1. BTC Technical Analysis: Consolidating After CPI+PPI Tailwinds
Current State
Bitcoin is trading in a $64,800-$65,100 range today, with 24-hour change of approximately +0.14% to +1%. The CPI (June 15) + PPI (June 16) double miss provided the clearest macro tailwind of 2026, but BTC faces profit-taking pressure near the $65,500-$66,000 resistance zone.
| Dimension | Detail |
|---|---|
| July Low | $57,950 (July 1, 21-month low) |
| CPI Day High | $65,055 (July 15) |
| Post-PPI High | $65,383 (July 16 Asian session) |
| Current | $64,800-$65,100 |
| Rally Magnitude | ~11.8%-12.4% (from $57,950) |
| CPI+PPI cumulative gain | ~+3% ($63K→$65K+) |
| 24h Volume | ~$55B (down from $65B, normal consolidation) |
Technical Indicators
RSI — Hovering at 50
- 14-day RSI: ~50-53 — at the 50 neutral line, slightly down from 52-55 on July 15
- Key interpretation: RSI at 50 suggests "neutral-bullish" but momentum fading — normal consolidation after a breakout
- Risk: if RSI drops below 50, it may signal the $65K breakout was a fakeout
MACD — Momentum Steadying
- Daily MACD: fast line still above slow line, but histogram growth slowing — momentum shifting from "accelerating" to "steady"
- This is normal energy restoration after a breakout. As long as no death cross forms, the trend remains positive
Moving Averages
| MA | Level | Status | Significance |
|---|---|---|---|
| 20-day MA | ~$63,200 | ✅ Above | Short-term support confirmed, rising from $62,800 |
| 50-day MA | ~$66,800 | ❌ Below | Medium-term resistance, slowly descending |
| 100-day MA | ~$68,500 | ❌ Below | Next major resistance |
| 200-week MA | $62,445 | ✅ Day 7 confirmed | Medium-term bullish signal SUSTAINED |
| 200-day MA | ~$74,500 | ❌ Below | Ultimate technical target |
| 50-month EMA | ~$65,300 | ❌ Below (not yet broken) | Trend reversal confirmation key level |
200-week MA ($62,445) Update: Day 7 of consecutive daily closes above this level — the longer this holds, the more reliable the medium-term bottom confirmation.
50-month EMA ($65,300) — Still Below: BTC approached within ~$245 (0.4%) of this key level on July 15, briefly touched $65,383 post-PPI, then fell back. Current gap is ~$400 (0.6%). This remains THE watershed level for medium-term trend determination.
Key Levels
| Level | Price | Significance |
|---|---|---|
| Resistance 4 | $73,000-$74,500 | 200-day MA (FxPro target) |
| Resistance 3 | $68,500-$70,000 | 100-day MA + psychological |
| Resistance 2 | $66,800-$67,000 | 50-day MA + prior high |
| Resistance 1 | $65,300-$65,500 | 50-month EMA (critical mid-term trend line) |
| Current | $64,800-$65,100 | Consolidation after CPI+PPI |
| Support 1 | $63,000-$63,500 | Pre-CPI consolidation range |
| Support 2 | $62,445 (200-week MA) | Medium-term core support (Day 7) |
| Support 3 | $60,000 | Last defense for bulls |
Scenario Probabilities (July 16 Update)
| Scenario | Prob | BTC Target | Trigger |
|---|---|---|---|
| 📈 $65K holds, rally to $68K-$70K | ~30% | $68K-$70K | PPI tailwind continues + CLARITY positive + FOMC dovish + ETF $100M+/day |
| ➡️ $64K-$66K range awaiting catalysts | ~50% | $65K ± $1.5K | PPI digested, market waits for CLARITY + FOMC |
| 📉 Pullback to $62K-$63K | ~20% | $61K-$63K | CLARITY stalls + Iran escalation + US gov sells + ETF outflows resume |
Change from July 15: With BTC briefly touching $65,383 but failing to close above, "Breakout" probability lowered from 35% to 30%. "Range" raised from 45% to 50% as the most likely scenario. Market focus shifts from macro data to CLARITY Act.
2. Altcoin Analysis
Top 10 by Market Cap
| Rank | Coin | Price | 24h Change | 7d Change |
|---|---|---|---|---|
| 1 | BTC | $64,800-$65,100 | +0.14%~+1% | +7% |
| 2 | ETH | $1,920-$1,928 | +2.0%~+2.45% | +10.6% |
| 4 | BNB | ~$581 | +0.5% | +3% |
| 6 | XRP | ~$1.11 | +0.3%~+0.6% | +3% |
| 7 | SOL | ~$77.40 | -0.3% | +5% |
| 9 | ADA | ~$0.187 | +2.5% | +8% |
| 10 | DOGE | ~$0.075 | +1.0% | +3% |
Ethereum (ETH) — Market Leader, $1,920-$1,928
ETH is up +2.0% to +2.45% today, continuing to outperform BTC and leading the top 10.
Drivers (accumulating):
- Macro tailwinds — PPI confirms CPI, ETH as high-beta asset benefits most
- Institutional ETF buying — ETH ETF posted $58.34M net inflows (July 15)
- Morgan Stanley staked ETH ETF filing — 0.14% fee, 50-80% staking
- Open interest at near-term high — $19.8B in ETH perpetual contracts
- Technical breakout — W-bottom pattern, descending trendline broken
- Short squeeze — $252.8M liquidated in 24h (96% shorts)
Technical levels:
- Support: $1,754 (W-bottom neckline), $1,880 (4h EMA50)
- Current resistance: $1,900-$1,950 (being tested)
- Next resistance: $1,980-$2,000 (200-day MA)
- ETH/BTC: >0.0295 — recovering from 0.028 low
Key signal to watch: ETH/BTC sustainably above 0.03 would signal a potential altcoin season onset.
ADA — Safe-Haven Narrative, ~$0.187
Cardano +2.5% today, benefiting from the "safe-haven" narrative (60%+ staking, zero security breaches, 400+ monthly commits).
3. Macro Environment Analysis
🟢 Bullish Factors
1. PPI Confirms CPI — Dual Inflation Cooling Confirmed
This is the core macro story:
- CPI (June): Headline 3.5% (est. 3.8%), Core 2.6% (est. 3.0%)
- PPI (June): 5.5% (est. 6.2%), MoM -0.3% (14-month record decline)
Gasoline prices fell 12% MoM — the primary driver of PPI's miss.
2. CME FedWatch — July Rate Hike Odds Collapse to 12%
| Scenario | Pre-PPI | Post-PPI | Change |
|---|---|---|---|
| July rate hike | ~31% | ~12% | ⬇️ Collapsed |
| July hold | ~69% | ~88% | ⬆️ Dominant |
| September cut | ~45% | ~45% | ➡️ Confirmed |
3. BTC ETF Positive Inflows
- July 15: $181M net inflow (BlackRock IBIT $139M lead)
- Second consecutive positive day
4. ETH ETF Inflows
- July 15: $58.34M (Fidelity FETH lead)
- Institutional interest in ETH warming up
5. DTCC Tokenization — Long-term Structural Positive Validates blockchain's real-world use case through TradFi's core infrastructure.
🔴 Bearish Factors
1. Profit-Taking Pressure Above $65K
- BTC up ~12.4% from July 1 low
- Short-term holders accumulated significant unrealized profits
- $65,300 (50-month EMA) not yet broken → some bulls reducing positions
2. CLARITY Act Uncertainty
- Polymarket passage odds at 43-46%
- Hearing today; outcome highly uncertain
3. US-Iran Conflict — Oil Risk
- Brent at $84.95
- No signs of de-escalation
- Lagging risk to CPI/PPI improvement
4. US Government Potential Token Sale
- $297M BTC/ETH moved to Coinbase Prime
- Could be sold, adding ~$300M sell pressure
5. Fear & Greed at 23-25 (Extreme Fear)
- While historically a bottom signal, it shows insufficient bullish conviction
4. On-Chain Data Analysis
Core Metrics
| Metric | Value | Status | Trend |
|---|---|---|---|
| NUPL | ~0.13 (anxiety→optimism) | Up from 0.12 | 📈 Improving |
| Supply in Profit | ~49% | Up from 48% | 📈 Improving |
| Exchange Balance % | 6.45% | 7-year low | 📈 Scarcity increasing |
| Exchange Balance (BTC) | ~1,280,000 BTC | Continuing decline | 📈 Extremely scarce |
| STH Unrealized Loss | ~10% underwater | Down from 15% (July 13) | 📈 Pressure easing |
| Funding Rate | +0.003% | Neutral-positive | ➡️ Neutral |
| Perpetual Basis | ~5.0% | Healthy range | ➡️ Stable |
Key Interpretation
Exchange Balance 6.45% — Scarcity Intensifying
- Only ~6.45% of BTC on exchanges (1.28M BTC)
- Self-custody rate: 93.55%
- Lowest ever recorded
Short-Term Holder Unrealized Loss Narrowing
- STH avg cost: ~$74,900
- Current underwater: ~10%
- Every $1K above $64K unlocks ~2-3% of STH positions
5. Outlook & Trading Strategy
Key Events This Week
| Date | Event | Impact | BTC Direction |
|---|---|---|---|
| July 17 | 🔥🔥🔥 CLARITY Act NYC Hearing | ⭐⭐⭐⭐⭐ | Defining regulatory variable |
| July 18 | 🔥 GENIUS Act rulemaking deadline | ⭐⭐⭐ | Stablecoin regulation |
| July 28-29 | 🔥🔥🔥 FOMC July Rate Decision | ⭐⭐⭐⭐⭐ | Medium-term direction |
| July 30 | 🔥🔥 Strategy Q2 Earnings | ⭐⭐⭐ | BTC strategy update |
Three Scenarios
Scenario 1: $65K confirmed, rally to $68K-$70K (~30%) — probability lowered
Confirmation signals:
- 3 consecutive daily closes above $65,000
- 50-month EMA ($65,300) reclaimed and held
- CLARITY Act hearing positive
- ETF inflows $100M+/day
- Volume returns to $60B+
Strategy: Add at $64,800-$65,200 on confirmation. First TP at $68K-$70K, second at $73K-$74K. Stop at $63,000.
Scenario 2: $64K-$66K range awaiting catalysts (~50%) — most likely, probability raised
CPI+PPI tailwinds fully priced in. Market enters "wait mode" — key events (CLARITY, FOMC) needed for direction.
Strategy: Light long at $64,000-$64,500, stop $63,500. Reduce at $65,500-$66,000. Keep <40% position. If $64K lost, wait for $63K-$63.5K. Key opportunity: ETH relative strength vs BTC.
Scenario 3: Pullback to $62K-$63K (~20%)
Strategy: If BTC pulls back to $63,000-$63,500 and holds 200-week MA, light long. If $62K lost, watch $60K. Reduce to <30% before FOMC. If ETH/BTC drops below 0.028, caution broad market weakness.
Rally Recap
| Date | BTC Price | Rally % | Key Event |
|---|---|---|---|
| July 1 | $57,950 (low) | — | 21-month low |
| July 10 | $64,524 | +11.3% | 200-week MA confirmed |
| July 13 | $63,700-$64,200 | +9.9-10.8% | Whale $4.3B dump |
| July 15 (CPI) | $65,055 | +12.2% | CPI → $65K breakout |
| July 16 (PPI) | $64,800-$65,383 | +11.8-12.8% | PPI miss but $65K not held |
Overall Assessment
As of July 16, the market shows a "macro improving but short-term momentum fading" character:
Technically:
- ✅ 200-week MA Day 7 confirmed — bottom signal strengthening
- ✅ 20-day MA rising to $63,200 — short-term support rising
- ⚠️ RSI at 50 — momentum fading, direction unclear
- ⚠️ 50-month EMA ($65,300) not yet broken — mid-term reversal unconfirmed
- ⚠️ 50-day MA ($66,800) still descending — bearish alignment intact
Macro:
- ✅ PPI confirms CPI — dual inflation cooling, best macro combo of 2026
- ✅ July hike odds at 12% — tail risk dramatically reduced
- ⚠️ US-Iran conflict — oil risk is a medium-term concern
Capital flows:
- ✅ BTC ETF $181M + ETH ETF $58M positive inflows
- ✅ Exchange balance 6.45% — supply scarcity intensifying
The key observation for July 16:
The CPI+PPI double miss provides the clearest macro signal of 2026, but BTC's price action at $65K shows heavier sell pressure than expected. This reflects:
- Pre-positioning — the rally from $57,950 (+12.4%) already priced in the macro improvement
- Regulatory overhang — CLARITY Act uncertainty suppressing institutional appetite
- Geopolitical hedge — US-Iran conflict and oil prices offsetting CPI/PPI gains
Structurally, ETH's relative outperformance is the most important signal of July 16. If ETH/BTC sustainably breaks above 0.03, it could signal a systematic capital rotation from BTC to ETH — historically a precursor to broader market moves.
⚠️ Risk Disclaimer: This analysis is for informational purposes only. The market is between CPI/PPI tailwinds and the CLARITY Act hearing. Cryptocurrency markets are extremely volatile. Please manage your risk carefully.
📚 Learning Resource: On-Chain Guide - Blockchain from Zero
Related: