
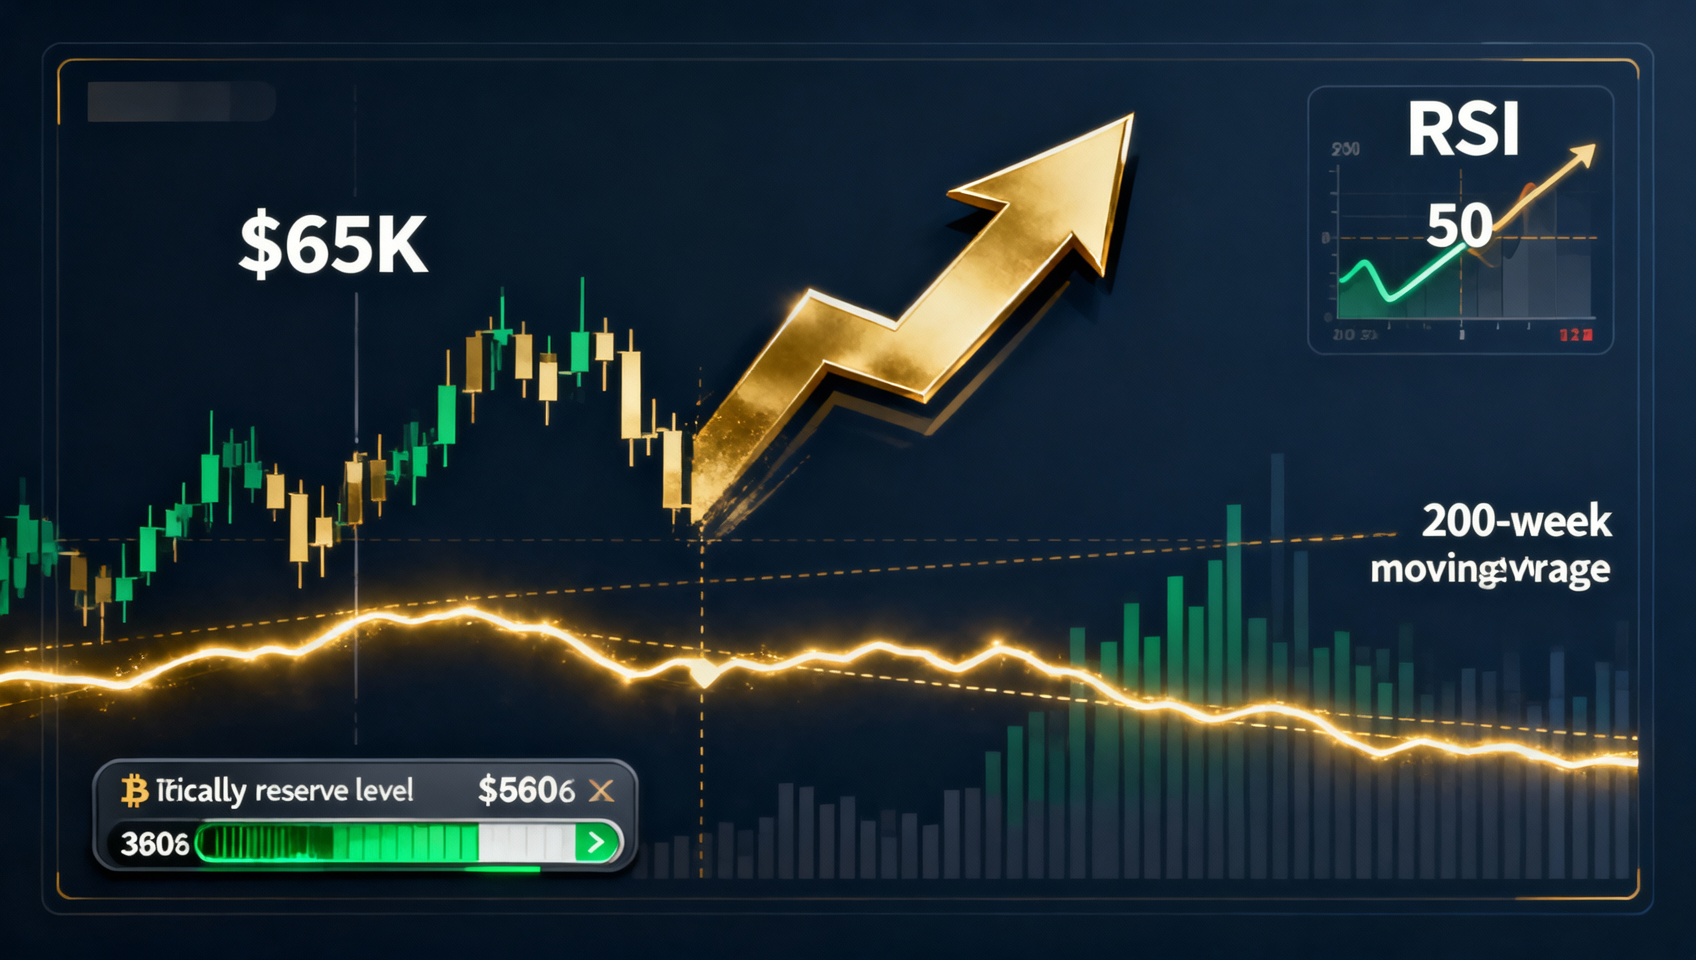
Deep Market Analysis July 15: BTC Breaks $65K — 12.2% Rally in 14 Days, RSI Crosses 50 for First Time Since July 1, June CPI Cools to 2.6% Core Fueling Rate Cut Hopes, Exchange Balance Hits 7-Year Low of 6.5%, FxPro Targets $73K-$74K, Upbit Volume Explodes 1,318%
Bitcoin surged past $65,000 (+3.5%) today for the first time since June 23, with the 14-day rally reaching 12.2%. The catalyst was June CPI significantly below expectations (core 2.6% vs est. 3.0%), pushing September rate-cut odds to 45%. Key technical milestone: RSI crossed above 50 for the first time since July 1 — trend shifting from bearish to neutral-bullish. MACD momentum is strengthening. The 200-week MA ($62,445) has been held for 6 consecutive days. Exchange balance falls to 6.5% — a 7-year low. South Korea's Upbit volume surged 1,318% to $4.2B, with XRP volume surpassing BTC on the exchange. FxPro analysts note the crypto market has broken above its 50-day MA, setting a target of $73K-$74K (200-day MA). The sustainability of the $65K breakout will determine whether this rally can upgrade into a full trend reversal.
Market Overview
| Metric | Value | 24h Change |
|---|---|---|
| Total Market Cap | ~$2.30T | 📈 +3.5% |
| BTC Price | $64,600-$65,055 | 📈 +3.5% |
| ETH Price | $1,876-$1,886 | 📈 +4.7%~+5.8% |
| SOL Price | ~$77.59 | 📈 +2.9%~+3.6% |
| XRP Price | $1.10-$1.11 | 📈 +3.5%~+3.8% |
| BNB Price | ~$580 | 📈 +2% |
| BTC Dominance | ~57.8% | 📉 Slight decline (capital rotating to alts) |
| Fear & Greed | 25 (Extreme Fear) | Up 3 from 22 |
| 24h Volume | ~$65B | Significantly up from ~$42B weekend |
| VIX | ~16.8 | Down from last week |
| DXY | 99.85 | 📉 -0.6% (weakening) |
1. BTC Technical Analysis: $65K Breakout — Rally Status Upgrade
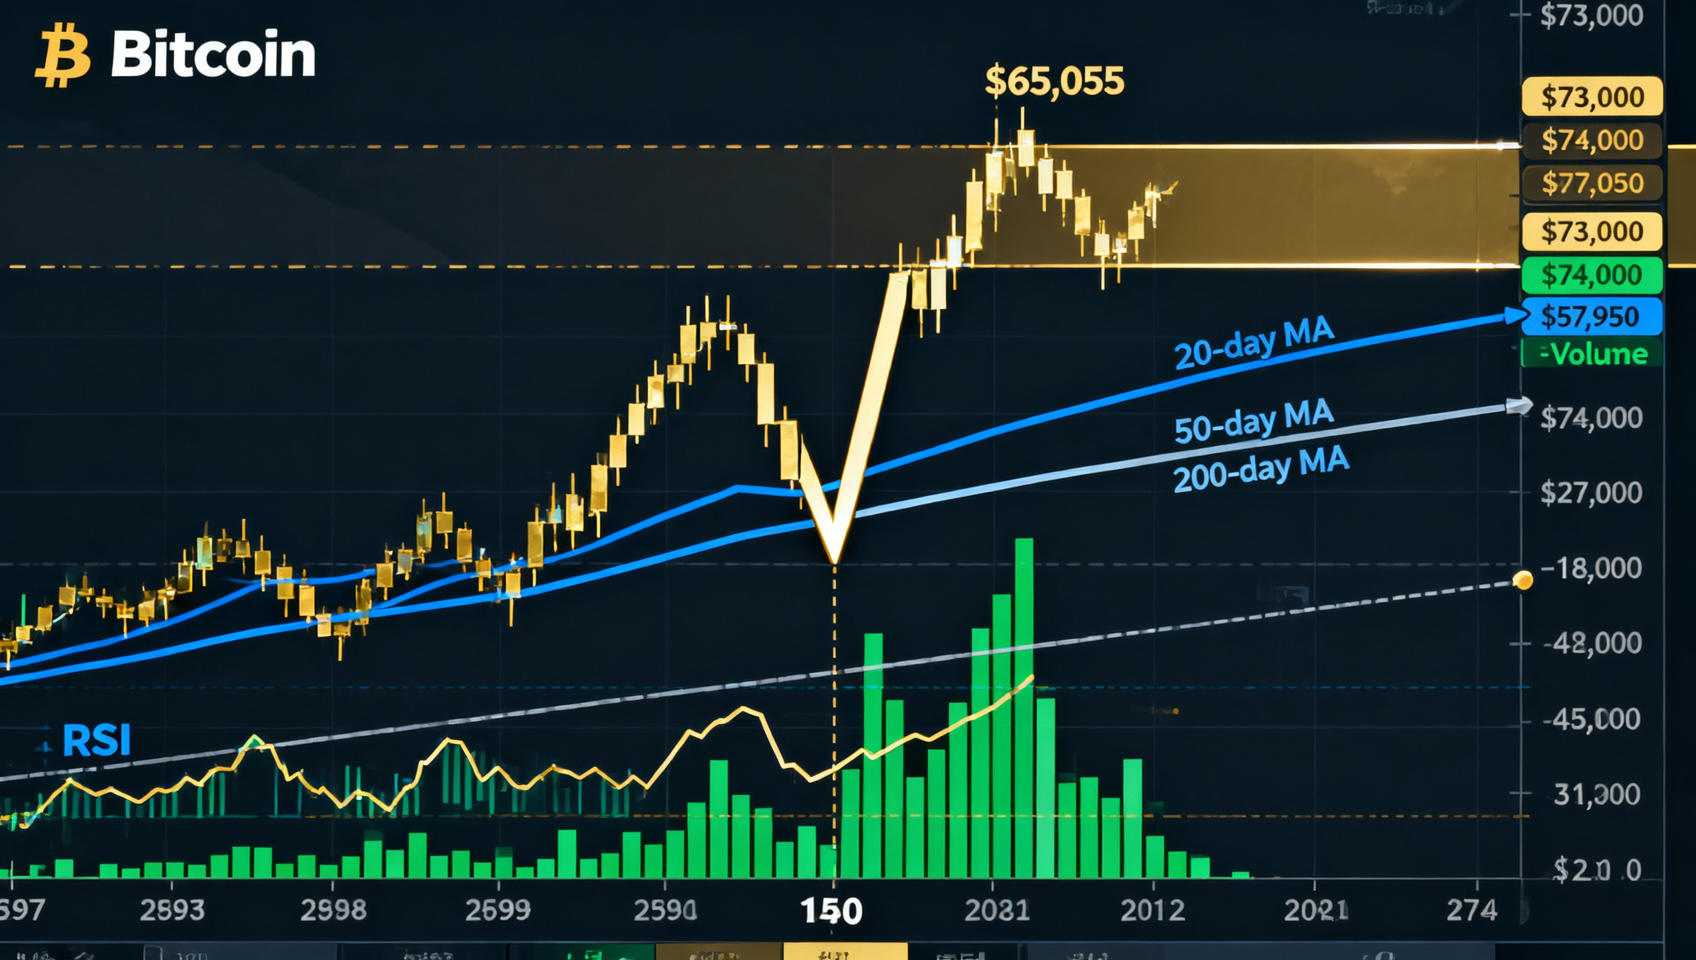
Bitcoin is trading at $64,600-$65,055 on July 15, up approximately +3.5% in 24 hours — the first time above $65,000 since June 23. The sub-expectation June CPI print was the direct catalyst.
| Dimension | Detail |
|---|---|
| July Low | $57,950 (July 1, 21-month low) |
| Current | $64,600-$65,055 |
| Rally Magnitude | ~11.5%-12.2% |
| Rally Duration | 14 days |
| Today's High | ~$65,055 (3-week high) |
| 24h Volume | ~$65B (significant recovery from weekend) |
| Gain from pre-CPI low ($61.5K) | ~+5.8% |
Technical Indicators
RSI — First Time Above 50 Since July 1
- 14-day RSI: ~52-55 — crossed above the 50 neutral line for the first time since July 1 — a critical technical signal
- The RSI took 14 days to recover from its July 1 low of ~25 to above 50
- Key interpretation: RSI crossing above 50 signals a shift from "downtrend" to "neutral-bullish" — the first technical confirmation of a trend change
- Caution: rapid rallies can push RSI into overbought territory (>65), building the case for a short-term pullback
MACD — Momentum Strengthening
- Daily MACD: Fast line well above slow line with widening gap — momentum significantly strengthened
- MACD Histogram: Above zero and growing — bullish momentum is increasing
- Overall: MACD shifted from "neutral-bearish" on July 13 to "bullish" — trend improving
Moving Averages
| MA | Level | Status | Significance |
|---|---|---|---|
| 20-day MA | ~$62,800 | ✅ Above | Short-term support confirmed, rising |
| 50-day MA | ~$67,200 | ❌ Below | Medium-term resistance (slowly descending from $67,600) |
| 200-week MA | $62,445 | ✅ Day 6 confirmed | Medium-term bullish signal SUSTAINED |
| 200-day MA | ~$73,500 | ❌ Below | FxPro target zone |
| 50-month EMA | ~$65,300 | ❌ Below (testing) | Trend reversal confirmation level |
200-week MA ($62,445) Update: Day 6 of consecutive daily closes above this level — fully confirmed as the most important medium-term bottom signal.
50-month EMA ($65,300) — Next Key Test: BTC is now only ~$245 (0.4%) below this long-term moving average — the closest approach since BTC fell from its $126K ATH in March. Reclaiming the 50-month EMA would serve as medium-term trend reversal confirmation.
Key Levels
| Level | Price | Significance |
|---|---|---|
| Resistance 4 | $73,000-$74,000 | 200-day MA (FxPro target) |
| Resistance 3 | $70,000 | Psychological round number |
| Resistance 2 | $66,500-$67,000 | 50-day MA + prior resistance |
| Resistance 1 | $65,500-$65,800 | Post-breakout confirmation zone |
| Current | $64,600-$65,055 | $65K just broken, needs confirmation |
| Support 1 | $63,000-$63,500 | Pre-breakout consolidation range |
| Support 2 | $62,445 (200-week MA) | Medium-term core support (Day 6) |
| Support 3 | $60,000 | Last defense for bulls |
Scenario Probabilities (July 15 Update)
| Scenario | Prob | BTC Target | Trigger |
|---|---|---|---|
| 📈 $65K holds, rally to $70K-$74K | ~35% | $68K-$74K | CPI tailwind + CLARITY positive + FOMC dovish + ETF $200M+/day |
| ➡️ $64K-$66K range digesting gains | ~45% | $65K ± $1.5K | CPI digested, market waits for CLARITY + FOMC |
| 📉 $65K fakeout, retest $62K-$63K | ~20% | $61K-$63K | CLARITY stalling + US-Iran escalation + US gov sells |
Change from July 13: With BTC actually breaking $65K, "Breakout" probability raised from 30% to 35% (CPI provided the catalyst), target raised from $65K-$68K to $68K-$74K. "Range" lowered from 50% to 45%. "Pullback" held at 20%.
2. Altcoin Analysis
Top 10 by Market Cap
| Rank | Coin | Price | 24h Change | 7d Change |
|---|---|---|---|---|
| 1 | BTC | $64,600-$65,055 | +3.5% | +10.3% |
| 2 | ETH | $1,876-$1,886 | +4.7%~+5.8% | +13.5% |
| 4 | BNB | ~$580 | +2% | +5% |
| 6 | XRP | $1.10-$1.11 | +3.5%~+3.8% | +6% |
| 7 | SOL | ~$77.59 | +2.9%~+3.6% | +7% |
| 10 | DOGE | ~$0.074 | +2.6%~+3.0% | +4% |
Ethereum (ETH) — Market Leader, $1,876-$1,886
ETH leads the top 10 with +4.7%~+5.8% today, up ~16.8% from late-June low of $1,609.
Drivers:
- ETH ETF inflows ($84.4M last week)
- Ethereum Foundation EthSystems spinout — institutional privacy focus
- Glamsterdam upgrade (target late Q3 2026) — gas limit to 200M, 10,000 TPS
- Robinhood L2 launch — bringing 60M+ users to ETH ecosystem
- WebX 2026 ongoing positive sentiment
Technical levels:
- Resistance: $1,900 (psychological) → $1,930-$2,000 (200-day MA)
- Support: $1,800-$1,806 (50-day EMA, broken above) → $1,700-$1,750
- ETH/BTC: 0.0292 — recovering from 0.028 low
Warning: ETH weekly chart shows a death cross (50-week MA below 200-week MA) — medium-term trend still bearish.
XRP — Korea Driven, $1.10-$1.11
XRP volume on Upbit exceeded BTC today — a historic moment for the Korean exchange. XRP has exceptionally high retail interest in Korea.
3. Macro Environment Analysis
🟢 Bullish Factors
1. June CPI Well Below Expectations — Most Important Macro Catalyst
| Indicator | Actual | Expected | Prior |
|---|---|---|---|
| Headline CPI YoY | 3.5% | 3.8% | 4.2% |
| Core CPI YoY | 2.6% | 3.0% | 3.1% |
| CPI MoM | 0.0% | +0.1% | +0.2% |
CME FedWatch: September rate-cut probability jumped from ~15% to ~45%.
2. Korean Capital Inflow — Marginal Buying Power
Upbit volume surged 1,318% to $4.2B as KOSPI entered a technical bear market. Korean retail historically provides important marginal demand in Asian trading sessions.
3. Social Volume at 21-Month Low — Contrarian Bullish Signal
41,800 daily comments — every prior instance of social volume at these levels preceded substantial BTC gains within 6-12 months.
4. Exchange Balance at 6.5% — Extreme Supply Scarcity
~1.29M BTC on exchanges — the lowest since 2017. 93.5% of BTC is in self-custody.
🔴 Bearish Factors
| Factor | Detail | Risk Level |
|---|---|---|
| Whale distribution | 100-1K BTC cohort dumped 67,000 BTC ($4.3B) on July 13 | 🟡 Medium |
| CLARITY Act | Hearing this week; odds ~40% | 🟡 Medium |
| US government transfer | $297M BTC/ETH moved to Coinbase Prime | 🟡 Medium |
| US-Iran conflict | Oil at $79-$80, Hormuz closure Day 4 | 🟡 Medium |
Comprehensive Assessment
| Dimension | Rating | Change (vs July 13) |
|---|---|---|
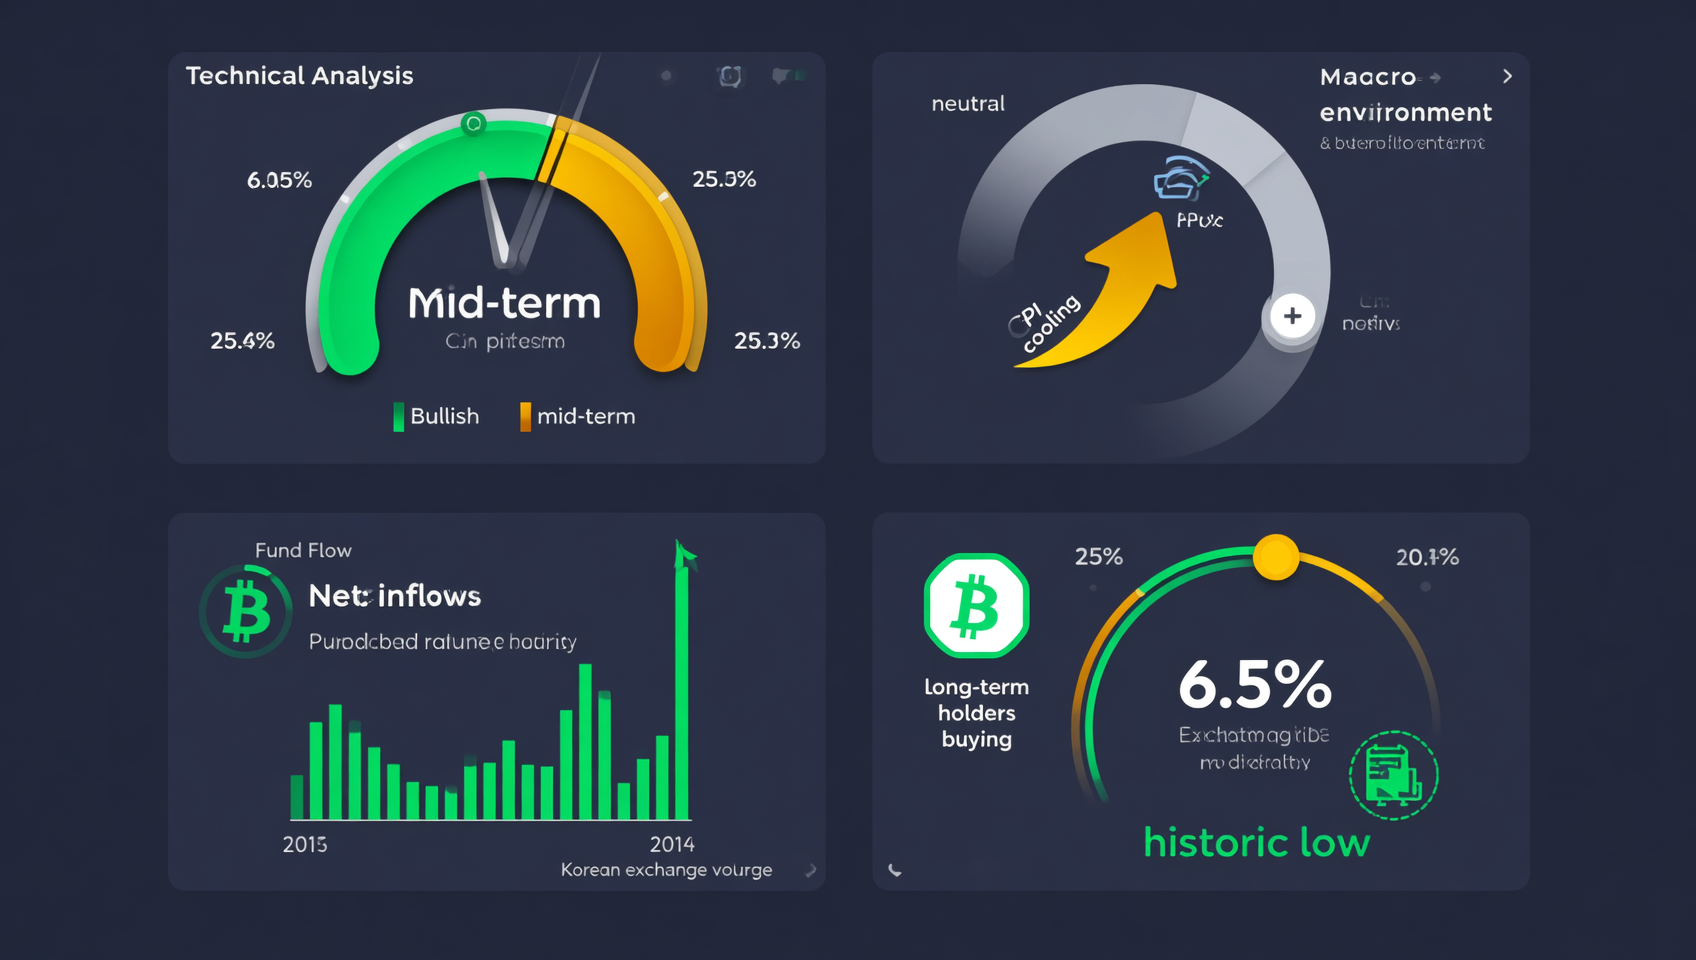
| Technical (short-term) | 🟢 Bullish — RSI >50, $65K broken | ⬆️ Significantly improved |
| Technical (medium-term) | 🟡 Neutral — MAs still bearish but 50-month EMA being tested | ⬆️ Improving |
| Capital flows | 🟢 Positive — ETF recovering, Korea capital flooding in | ⬆️ Significantly improved |
| On-chain | 🟢 Positive — Exchange balance 6.5%, LTH buying | ➡️ Unchanged |
| Macro | 🟢 Positive — CPI significantly below expectations | ⬆️ Massively improved |
| Regulatory | 🟡 Neutral — CLARITY hearing pending | ➡️ Unchanged |
| Sentiment | 🟡 Neutral-fear — Index 25, social volume at lows | ⬆️ Slightly improved |
4. On-Chain Data Analysis
Core Metrics
| Metric | Value | Status | Trend |
|---|---|---|---|
| NUPL | ~0.12 (anxiety→optimism transition) | Rising from 0.07 | 📈 Improving |
| Supply in Profit | ~48% | Up from 46% on July 13 | 📈 Improving |
| Exchange Balance % | 6.5% | 7-year low | 📈 Scarcity increasing |
| Exchange Balance (BTC) | ~1,290,000 BTC | Lowest since 2017 | 📈 Extremely scarce |
| STH Unrealized Loss | ~12% underwater | Down from 15%; avg cost $74.9K | 📈 Pressure easing |
| Funding Rate | ~0.005% (slightly positive) | From neutral 0 on July 13 | 📈 Long sentiment returning |
| Perpetual Basis (annualized) | ~5.5% | From 4.0%, nearing healthy range | 📈 Improving |
Key Interpretation
Supply Rotation, Not Exit
- 100-1K BTC: Sold 67,000 BTC ($4.3B) in a single day
- 10-10K BTC: Accumulating 11,000 BTC/week
- Net interpretation: Early holders distribute to new capital — a classic mid-cycle signal
Exchange Balance 6.5% — Extreme Scarcity
- Only ~6.5% of BTC is on exchanges ready to trade
- Any positive demand catalyst could trigger a "supply vacuum" price surge
- Historical comparison: 2017 low of 12% preceded rally to $19K; 2020 low of 13% preceded rally to $69K
Derivatives Market — Improving
| Metric | Value | Status | Interpretation |
|---|---|---|---|
| Funding rate | +0.005% | ✅ Slightly positive | Long sentiment returning |
| Quarterly basis | ~5.5% | ✅ Near healthy range | Improved from 4.0% |
| Options 25-delta skew | ~5% (call premium) | ✅ Bullish | Call option demand increasing |
| Polymarket $65K | ~56% | ✅ | Market expects $65K to hold |
5. Outlook & Trading Strategy
Remaining Catalysts
| Date | Event | Impact | BTC Direction |
|---|---|---|---|
| This week | 🔥🔥🔥 CLARITY Act Senate Hearing | ⭐⭐⭐⭐⭐ | Regulatory direction |
| Before July 23 | 🔥🔥 US-Iran Talks Progress | ⭐⭐⭐ | Geopolitical premium |
| July 28-29 | 🔥🔥🔥 FOMC July Rate Decision | ⭐⭐⭐⭐⭐ | Medium-term direction |
| July 30 | 🔥🔥 Strategy Q2 Earnings | ⭐⭐⭐ | BTC strategy update |
Three Scenarios
Scenario 1: $65K holds, rally to $70K-$74K (~35%)
Confirmation signals:
- 3 consecutive daily closes above $65,000
- 50-month EMA ($65,300) reclaimed
- CLARITY Act hearing positive
- ETF inflows $100M+/day
- Volume sustained at $50B+
Strategy: Add at $64,500-$65,000 to 50-65% position. First take-profit at $68K-$70K, second at $73K-$74K. Stop at $62,500.
Scenario 2: $64K-$66K range digesting gains (~45%) — most likely
Strategy: Light long at $64,000-$64,500, stop $63,000. Reduce at $65,500-$66,000. Keep below 50%. If $65K holds, raise stop to $64,000.
Scenario 3: $65K fakeout, retest $62K-$63K (~20%)
Strategy: If BTC pulls back to $63,000-$63,500 and holds 200-week MA, light long. If $62,500 lost, watch $60K. Reduce to <30% before FOMC.
Rally Recap
| Date | BTC Price | Rally % | Key Event |
|---|---|---|---|
| July 1 | $57,950 (low) | — | 21-month low, Fear Index 22 |
| July 4 | $60,500 | +4.4% | Weekend recovery |
| July 8 | $62,000 | +7.0% | 200-week MA test |
| July 10 | $64,524 | +11.3% | 200-week MA confirmed |
| July 13 | $63,700-$64,200 | +9.9%-10.8% | Weekend consolidation |
| July 15 | $64,600-$65,055 | +11.5%-12.2% | CPI → $65K breakout |
Overall Assessment
As of July 15, both technical and macro conditions have shown significant improvement:
Key technical signals:
- ✅ $65,000 broken — ends the downtrend since June 23
- ✅ RSI above 50 for first time since July 1 — trend neutral-bullish
- ✅ 200-week MA Day 6 confirmed — medium-term bottom validated
- ✅ 50-month EMA ($65,300) approaching — potential trend reversal signal
- ✅ Volume confirmed breakout — volume significantly expanded
Key macro signals:
- ✅ June CPI well below expectations — core 2.6% is lowest since August 2025
- ✅ September rate-cut odds jump to 45% — market pricing shifts dovish
- ✅ Korea capital inflow — Upbit +1,318% provides marginal demand
The $65K breakout quality depends on confirmation over the next 3 days. If $65K holds as support, technical targets are $68K-$70K (short-term) and $73K-$74K (FxPro target, 200-day MA). However, be cautious of "buy the rumor, sell the fact" pullbacks ahead of the July 28-29 FOMC decision, especially with significant short-term profit accumulation in the $65K-$70K range.
⚠️ Risk Disclaimer: This analysis is for informational purposes only and does not constitute investment advice. Cryptocurrency markets are extremely volatile. Please manage your risk carefully and make decisions based on your own circumstances.
📚 Learning Resource: On-Chain Guide - Blockchain from Zero
Related: