
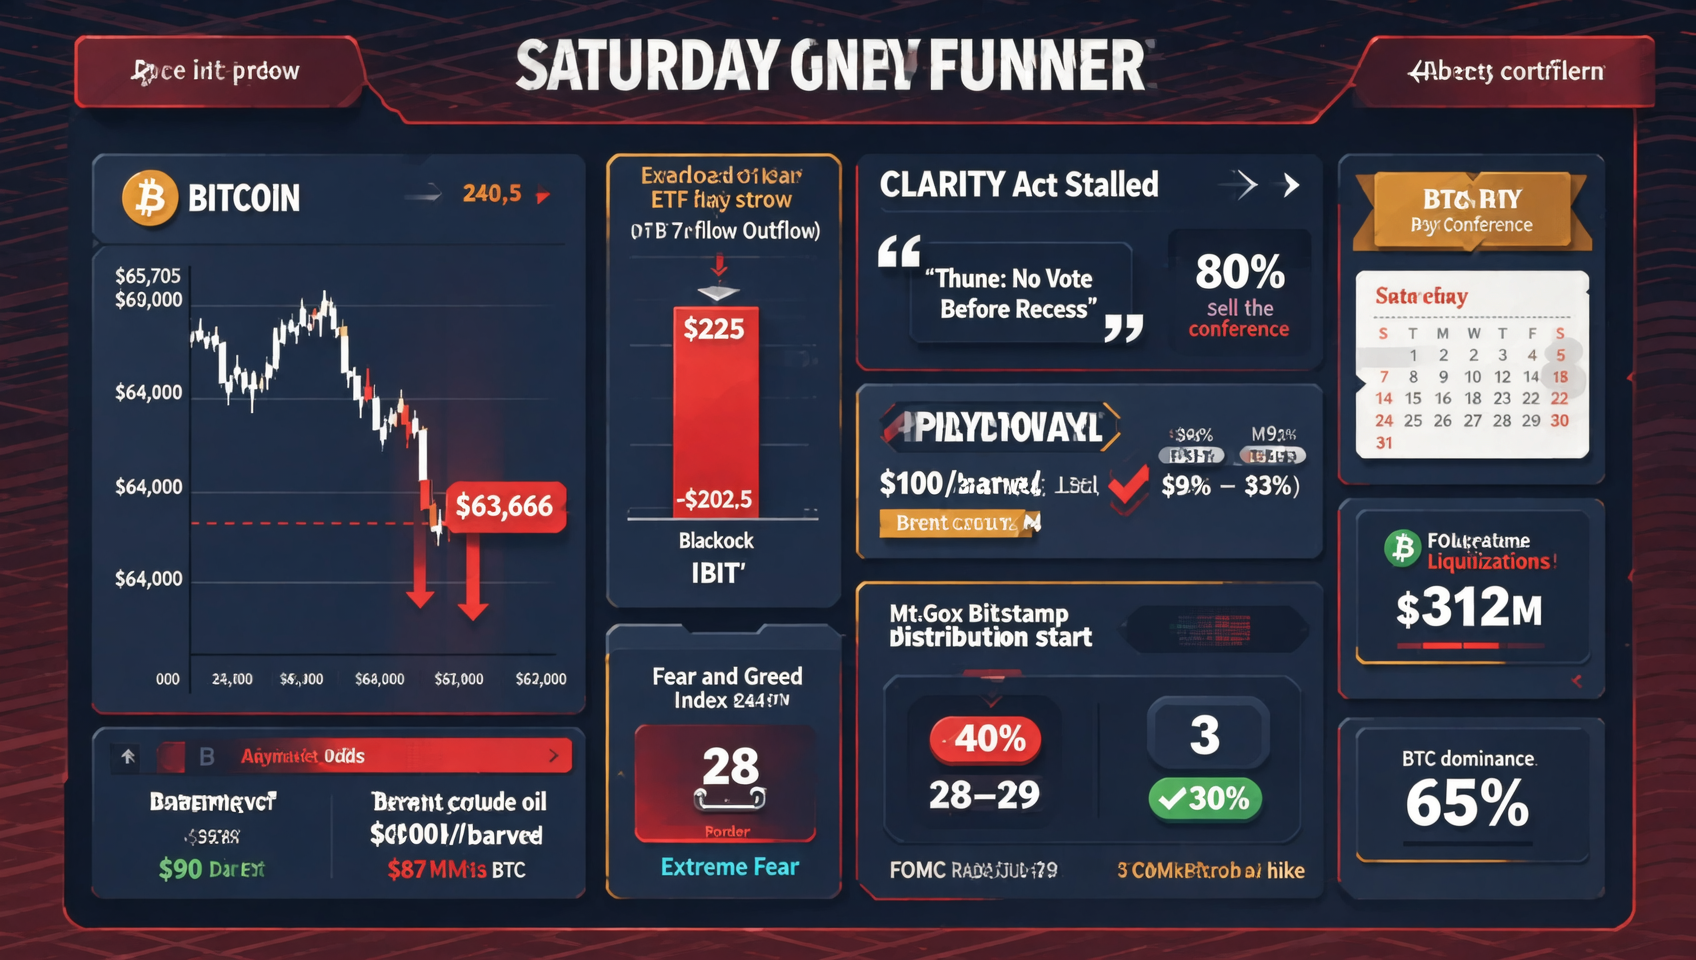
July 25: BTC Breaks Below $64K — ETF 7-Day $981M Inflow Streak Ends With $225M Outflow, Thune Says CLARITY Recess Hopes Dashed, Oil Retreats Below $100, BTC Conference Curse Strikes Again
BTC broke below $64K on Friday after spiking to $65,705, hitting an intraday low of $63,666 — down 1.5% in 24h. The 7-day ETF inflow streak ended with $225M in net outflows ($202.5M from BlackRock IBIT), signaling institutional capital withdrawal. Senate Majority Leader Thune publicly stated the CLARITY Act is unlikely to pass before the August recess, pushing Polymarket odds to 33%. Oil retreated from above $100 to ~$98/barrel, partially easing macro pressure. The BTC conference sell-the-event pattern struck again, Fear and Greed fell to 28 (Fear), BTC dominance stayed above 65%, and 24h liquidations reached $312M. Bitstamp began Mt. Gox creditor distributions.
July 25 Crypto Market Headlines
| Event | Key Point |
|---|---|
| 📉 BTC Breaks Below $64K, Low $63,666 | Spiked to $65,705 then plunged — currently $63,800-$64,200 range, 24h -1.5% |
| 🏦 🚨 ETF 7-Day Inflow Streak Ends — $225M Outflow | BlackRock IBIT accounts for $202.5M outflow — institutional capital withdrawal signal |
| 🏛️ 🔥 Thune Says CLARITY Unlikely Before Recess | Senate Majority Leader publicly dashes hopes, Polymarket odds fall to 33% |
| 🛢️ Oil Retreats from $100+ to $98 | Brent crude pulls back — macro pressure partially eased |
| 📊 BTC Conference Historical Curse Strikes Again | Bitcoin Conference opens July 25, BTC historically declines during the event |
| 😨 Fear and Greed Falls to 28 (Fear) | Approaching 'Extreme Fear' — market sentiment at recent lows |
| 💥 24h Liquidations $312M | BTC $87M, ETH $56M — concentrated long liquidation |
| 📜 Bitstamp Begins Mt. Gox Distribution | Creditors start receiving BTC/BCH/ETH — selling pressure concerns resurface |
| 🗓️ FOMC July 28-29 Countdown | Rate hike odds drop from 40% to ~30% — oil retreat eases expectations |
I. 📉 BTC Breaks Below $64K — Full Intraday Picture
Classic 'Spike and Dump' Action
BTC Friday showed a textbook 'spike and retreat' pattern:
| Phase | Time | Price | Characteristic |
|---|---|---|---|
| Asian Range | Early Jul 25 | $64,200-$64,800 | Held above $64K — awaiting direction |
| Spike | US ET 3:15 | $65,705 📈 | $1K quick surge — triggered short stops |
| Sharp Decline | Within 7 hrs | $65,705 → $63,666 📉 | Concentrated selling — long squeeze |
| Recovery Bounce | Current | $63,800-$64,200 📊 | Oversold bounce — but limited momentum |
Key Price Levels
| Level | Price | Significance |
|---|---|---|
| Resistance 3 | $66,200-$66,965 | July 22 breakout zone — now left behind |
| Resistance 2 | $65,500-$65,800 | Key resistance — today's spike to $65,705 tagged it exactly |
| Resistance 1 | $64,800-$65,000 | Short-term resistance — $65K psychological level |
| Current | ~$63,800-$64,200 | Below $64K — near the bull-bear divide |
| Support 1 | $63,500-$63,800 | Today's low $63,666 — buffer zone |
| Key Support | $62,335-$63,500 | 4H order block + 0.618 Fib — if lost, bearish deepens |
| Strong Support | $59,356-$62,492 | 200-week MA region — bull-bear boundary |
Technical Indicators
| Indicator | Current | Interpretation |
|---|---|---|
| RSI (14) | ~38 | Slight recovery from yesterday's 27 (oversold) — but still in weak territory |
| MACD | Fast line below zero | Short-term momentum turns negative — bears in control |
| Volume | Significantly elevated | Selling on volume — real selling pressure, not a vacuum drop |
| BTC Dominance | ~65%+ | Pulled back (from 68%+) but still elevated — capital not yet returning to alts |
| 4H Candle Structure | Stepped decline | Weakening since $65,808 high — descending channel |
BTC's action today (July 25) can be summarized as 'spike, retreat, key level loss.' The $65,705 spike lured in short-term longs, and the subsequent 7-hour plunge caught them off guard. Losing the $64K psychological level further amplified panic. However, looking from another angle — the $63,666 low sits near the 0.382 Fibonacci retracement of the rally since July 1, meaning this is not an irrational crash but follows technical logic. 1
II. 🏦 🚨 ETF 7-Day Inflow Streak Ends — $225M Outflow Signal
Full Data Picture
| Metric | Jul 17-23 (7-Day Inflow Streak) | Jul 24 (Reversal) |
|---|---|---|
| Net Flow | +$981M | -$225.2M 🚨 |
| Leading Fund | BlackRock IBIT led | BlackRock IBIT -$202.5M |
| Other Funds | Fidelity/Fidelity etc. all positive | FBTC -$5.6M, BITB -$7M, ARKB -$4.3M |
| Positive Inflow Funds | All positive | Only Morgan Stanley MSBT +$5M |
| Cumulative Net (Since Launch) | ~$51.8B | Unchanged |
Interpreting the Outflow — Retreat or Profit-Taking?
The $225.2M net outflow (especially IBIT's $202.5M) needs to be understood from multiple angles:
- Institutional profit-taking — BTC rose 13% over the past 7 days ($57,750 → $65,705), and $225M outflow is reasonable relative to that rally
- CLARITY disappointment — Thune's July 24 statement that CLARITY is 'unlikely before recess' directly hit regulatory passage expectations, leading institutions to reduce positions
- Geopolitical risk avoidance — Ongoing Middle East tensions and oil above $100 pressure prompted risk managers to trim BTC exposure
- Technical breakdown — After BTC fell below $65K, some quant strategies triggered position reduction signals
No Need for Excessive Pessimism
- Weekly still net positive $274M — the week still shows net inflows, suggesting the trend hasn't fully reversed
- ETH ETF still net positive — $26.3M in inflows shows capital rotating within crypto, not leaving entirely
- Divergent institutional attitudes — Morgan Stanley's MSBT still posting net inflows (+$5M) 2
The end of the 7-day inflow streak and the $225M outflow are important turning signals for late July crypto markets — but they are more likely a 'normal pullback within an uptrend' rather than a structural reversal. A profit-taking event after $981M in consecutive inflows is extremely routine market behavior. The real warning signal would be if outflows continue to widen next week (daily >$300M) — that would suggest the trend has shifted. 2
III. 🏛️ CLARITY Act — Senate Leader Personally Dashes Hopes
The Weight of Thune's Statement
On July 24, Senate Majority Leader John Thune (R-SD) directly told media: he does not expect the Senate to pass the CLARITY Act before the August recess.
| Statement Point | Interpretation |
|---|---|
| 'I hope we at least get a start on CLARITY' | Language no longer contains passage expectation — shifted to 'start the process' |
| Insufficient timeline | Senate only has the last week of July + first week of August working |
| Competing priorities | Sanctions bills, government funding, defense authorization, Graham funeral all occupy the agenda |
Why CLARITY Stalled at the Last Minute
| Reason | Detail |
|---|---|
| Ethics provision deadlock | Core dispute over ethics restrictions on Trump profiting from crypto projects — Democrats demand stronger constraints; Republican latest draft puts enforcement under DOJ (White House oversight), Democrats say it's insufficient |
| Election year politics | November midterms loom — Democratic senators unwilling to hand a legislative victory to Republicans before the election |
| Banking opposition | Banking groups lobby against stablecoin reward programs — claim they drain traditional bank deposits |
| 60-vote threshold | Republicans hold 53 seats, need at least 7 Democratic votes — currently at least 7 Democrats openly opposed |
Market Impact
| Scenario | Probability | BTC Impact |
|---|---|---|
| September push after recess (likely) | ~55% | 🟡 Positive delayed, not canceled — short-term bearish already priced |
| Miraculous pre-recess passage | ~5% | 🟢🟢 Massive positive — but extremely low probability |
| Passage in 2026 (post-election window) | ~33% | 🟡 Uncertain — persistent uncertainty |
| Bill effectively dies | ~7% | 🔴🔴 Major negative — regulatory uncertainty continues for years |
Thune's public statement is the decisive turning point that moves the CLARITY Act from 'highly likely to pass' to 'likely delayed.' The market had already priced in CLARITY's passage (BTC rallying from $57,950 to $66,965), and now those gains are being gradually unwound — because the disappearance of a regulatory catalyst means BTC needs to find new upward drivers. 3
IV. 🛢️ Oil Retreats Below $100 — Macro Pressure Partially Eased
Oil Price Action
| Time | Brent Crude | Change |
|---|---|---|
| July 24 High | >$100/barrel | Broke $100 — first time since August 2025 |
| July 25 (Today) | ~$97-$98/barrel | 📉 Dropped roughly $2-3 from above $100 |
Positive Transmission to Crypto Markets
| Transmission Channel | Effect |
|---|---|
| FOMC rate hike odds decline | Oil retreat → inflation expectations cool → July rate hike odds drop from 40% to ~30% |
| Risk appetite recovery | Lower energy prices → risk-off sentiment eases → pressure on risk assets reduces |
| Dollar index retreat | Oil retreat → USD weakens → BTC headwind partially lifts |
The $2-3 retreat from above $100 may seem modest, but its impact on market sentiment goes far beyond the number — it means the inflation spiral is unlikely to be triggered in the short term, and the probability of the FOMC being 'forced to hike' on July 29 is declining. 4
V. 🔄 BTC Conference Historical Curse — July 25 Coincidence
The 'Sell the Event' Pattern
July 25, 2026 marks the opening of the annual Bitcoin Conference. There is a well-known phenomenon in crypto markets — BTC tends to fall during the conference:
| Conference Year | BTC Change |
|---|---|
| July 2024 (Nashville) | 📉 Trump speech: BTC dropped from $69K to $66K — -4% |
| July 2025 | 📉 BTC generally weakened during the conference |
| July 2026 (Today) | 📉 Already fallen from $65,705 to $63,666 — -3.1% |
The Logic Behind the Curse
- 'Buy the rumor, sell the fact' — pre-conference hype pushes prices higher, capital exits during the event
- Position adjustment — institutions and whales accumulate before the conference, reduce during the event
- Disappointing rhetoric — if guest speeches lack substantive positives, markets react negatively
While 'sell the event' suffers from some sample bias (only 3-4 years of historical data), the July 25, 2026 price action does validate the pattern once again. The $65,705 → $63,666 decline is almost a mirror image of the $69K → $66K move during the 2024 Nashville conference — both featured a spike followed by a retreat. 5
VI. 💥 $312M Liquidated — Concentrated Long Squeeze
Liquidation Data
| Dimension | Data |
|---|---|
| Total Liquidations | $312M (24h across all exchanges) |
| Long Liquidations | $242M (78% of total) |
| Short Liquidations | $70M |
| BTC Liquidations | $87M (longs $70M) |
| ETH Liquidations | $56M (mostly longs) |
What Is Normal
- Normal daily liquidations: ~$100M-$150M
- Today's liquidations: $312M (2x+ normal level)
- 2026 peak liquidations: June 18 $680M
The $312M liquidation figure is not extreme, but it confirms that the leveraged market experienced a 'mini waterfall' event. 6
VII. 💎 Altcoin Performance — Under Pressure Across the Board
| Coin | Price | 24h Change | Key Level |
|---|---|---|---|
| ETH | ~$1,854-$1,925 | 📉 -1.5% to -2% | Support $1,830, Resistance $1,950 |
| SOL | ~$73-$77 | 📉 -1.5% to -2.5% | 74% off ATH, ETF still flowing in |
| XRP | ~$1.08-$1.13 | 📉 -0.26% (weekly) | 7 spot ETFs AUM >$1B, but CLARITY delay is negative |
Notable Details Per Coin
ETH: ETH/BTC rate continues to weaken, dropping from yesterday's 0.0295 to approximately 0.029. $1,830 is the short-term key support — if lost, ETH could fall toward the $1,750-$1,800 range.
SOL: Despite being down 74% from its January 2025 all-time high of $294.33, SOL ETF inflows continue — forming a 'price decline vs. institutional inflow' divergence signal. The 20-day and 50-day MAs are converging near $76.80 — suggesting an imminent directional choice. RSI at 52.83 is neutral.
XRP: The CLARITY Act delay hits XRP the hardest — prospects for XRP's reclassification as a digital commodity have been postponed. However, the 7 spot XRP ETFs' AUM has surpassed $1B, and the SEC v. Ripple settlement conference is scheduled for early July 26 — a major catalyst for XRP. 7
VIII. 🌍 Macro & Geopolitical Panorama
| Dimension | Latest Developments | Impact |
|---|---|---|
| US-Iran Conflict | US deploys 1,000 troops to Middle East; Houthis attack Saudi oil tanker | Risk premium persists — but oil has retreated from $100+ |
| US Stocks | $800B tech sell-off — but BTC shows relative resilience | Decoupling signal between BTC and traditional risk assets |
| 30-Year Treasury Yield | 5.25% — critical level | Elevated bond yields continue attracting capital out of risk assets |
| Bitstamp Mt. Gox | Begins distributing BTC/BCH/ETH to creditors | Market worried about selling pressure — but distribution scale is limited |
| Korean Kimchi Premium | BTC -0.81% (negative premium) | Korean retail sentiment depressed |
IX. 🔮 FOMC Preview — 3 Days Countdown
Latest Odds
| Decision Direction | Polymarket Odds | Change vs Yesterday |
|---|---|---|
| Hold Rates | ~70% | 📈 +10% (oil retreat improves expectations) |
| Hike 25bp | ~30% | 📉 -10% (oil retreated from $100) |
| Cut Rates | <3% | Unchanged |
Key Watch Points
Saturday through Monday is the FOMC 'quiet period' — markets typically maintain current pricing until the decision is announced. However, oil price action remains a wildcard. 8
X. 🔮 Key Calendar for the Week Ahead
| Date | Event | Impact Level |
|---|---|---|
| Jul 25-27 | 🔥 Bitcoin Conference (Weekend) | ⭐⭐⭐ |
| Jul 26 | SEC v. XRP Settlement Conference | ⭐⭐⭐ |
| Jul 28-29 | 🔥🔥🔥 FOMC Rate Decision | ⭐⭐⭐⭐⭐ |
| Jul 31 | BTC monthly close — likely bearish candle | ⭐⭐⭐⭐ |
| Aug 7 | Congress recess deadline — last window for CLARITY | ⭐⭐⭐⭐⭐ |
Scenario Analysis
| Scenario | Probability | BTC Target Range | Trigger |
|---|---|---|---|
| 📉 BTC Continues Down to $62K-$63K | ~40% | $61K-$63K | FOMC hawkish + CLARITY delay + sustained ETF outflows |
| ➡️ $63K-$65K Range Consolidation | ~35% | $64K±$1K | FOMC holds rate + ETF outflows narrow + oil stabilizes |
| 📈 Oversold Bounce to $65K-$66K | ~25% | $64.5K-$66K | FOMC dovish + CLARITY positive + ETF re-inflows |
⚠️ Risk Disclaimer: This article is an in-depth news review and does not constitute investment advice. BTC broke below $64K today (low $63,666). The 7-day ETF inflow streak ended with $225M in outflows (IBIT -$202.5M). CLARITY Act hopes dashed by Thune saying it's unlikely before recess. Oil retreated from $100+ to $98 — one of the few positives. Fear and Greed at 28, approaching Extreme Fear. FOMC (July 28-29) is the core risk event, but rate hike odds have fallen from 40% to ~30%. Cryptocurrency markets are extremely volatile — manage risk carefully.
Recommended: Binance Registration | OKX Registration
📚 Further Reading: On-Chain Guide - Blockchain from Zero — Blockchain technology introduction and on-chain data analysis tutorials
📖 Related reads:
Footnotes:
Footnotes
-
Source: Gate.io "Bitcoin Breaks Below $64,000, Triggering $87M in Liquidation"; TradingView BTC/USD data, July 25, 2026 ↩
-
Source: Baiyi "Bitcoin ETF Outflows Hit $225M, Ending Seven-Day Inflow Streak"; CoinCodex "Bitcoin ETFs Near $1 Billion in Just Seven Sessions," July 25, 2026 ↩ ↩2
-
Source: Crypto.news "John Thune shuts down hopes for CLARITY Act vote"; Bitget News "Clarity Act on the Ropes"; Coindesk "CLARITY Act expected to miss its window," July 24-25, 2026 ↩
-
Source: Bloomberg/Brent crude oil price data; Cointelegraph Brasil "Bitcoin perde os US$ 64 mil," July 25, 2026 ↩
-
Source: HTX "Bitcoin Conference Tomorrow: What to Expect"; historical price comparison data, 2024-2026 ↩
-
Source: Coinglass liquidation data; Gate.io "Bitcoin Breaks Below $64,000, Triggering $87M in Liquidation," July 25, 2026 ↩
-
Source: Baiyi "XRP Has All the Bullish Catalysts — Why Isn't the Price Reacting?"; Investing.com "Solana ETF Inflows Challenge Bearish Signal," July 25, 2026 ↩
-
Source: Polymarket FOMC prediction odds; Weiss Ratings "Has Bitcoin Already Bottomed?," July 25, 2026 ↩