
July 28: FOMC Day 1 — BTC Drops to $63,414, 150K+ Liquidations, ETH/BTC Breaks Above 200 DMA for First Time Since January 2026
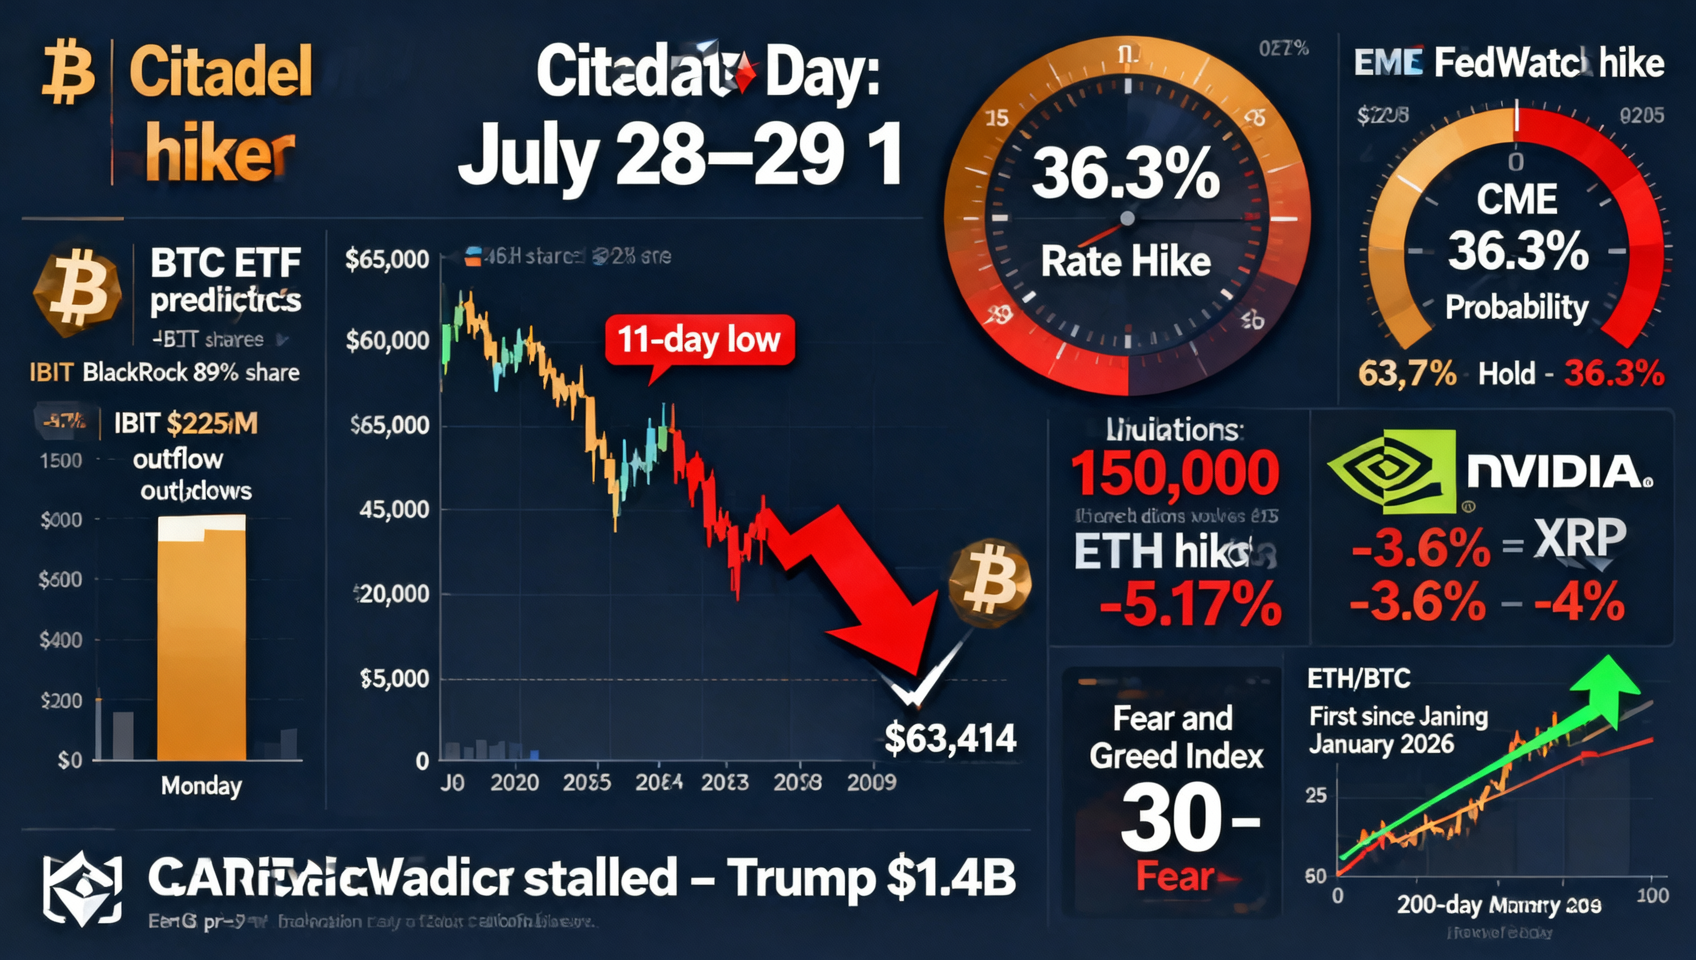
BTC drops 2.3% to $63,414 (11-day low) as FOMC Day 1 opens, with CME FedWatch pricing 63.7% hold and 36.3% hike probability — the highest pre-FOMC hike expectation since 2024. Over 150,000 traders liquidated in 24 hours, with ETH (-3.6%) and XRP (-4%) leading the decline. BTC ETFs recorded $225M net outflows Monday, signaling institutions sold into the $65K bounce. NVIDIA plunged 5.17% dragging the AI sector, with crypto-AI correlation exceeding 80%. ETH/BTC breaks above the 200-day moving average for the first time since January 2026 — ETH's July gain of +24% far exceeds BTC's +10%. CLARITY Act remains stalled over Trump's $1.4B crypto profits ethics clause. Fear & Greed Index at 30 (Fear). ~$13-14B BTC+ETH options expiry looms this week.
July 28 Crypto News Headlines at a Glance
| Event | Key Points |
|---|---|
| 📉 BTC Drops to $63,414 | FOMC Day 1 Asian selloff -2.3%, 11-day low — currently ~$63,791 |
| 🏛️ FOMC Day 1 Begins | July 28-29 rate decision — CME FedWatch: 63.7% hold, 36.3% hike |
| 💥 150K+ Liquidations | 24h global liquidations — ETH leads drop (-3.6%), XRP -4%+ |
| 🏦 BTC ETF Net Outflows $465M+ | July 23-24 two-day outflow snaps 7-day inflow streak — BlackRock IBIT accounts for 89% |
| 📉 NVIDIA Crashes 5% Drags Tech + Crypto | AI sector selloff deepens — crypto-AI correlation exceeds 80% |
| 🕊️ Oil Drops 8% on US-Iran Ceasefire Extension | Brent from $100 to $88.36 — bullish for inflation but overshadowed by FOMC uncertainty |
| 💎 ETH/BTC Breaks Above 200 DMA | First time since January 2026 — ETH July +24% far exceeds BTC +10% |
| 🔴 CLARITY Act Involves Trump's $1.4B Crypto Profits | Ethics clause deadlock unresolved — passage odds drop to ~38% |
| 😨 Fear & Greed Index at 30 (Fear) | Down from 39 yesterday — sentiment deteriorates ahead of FOMC |
| ⚠️ $13-14B Options Expiry This Week | BTC + ETH options expire Friday — could amplify volatility |
一、📉 FOMC Day 1: BTC Plunges to $63,414 — Asian Session Selloff
Price Action Timeline (July 27→28)
| Phase | Price | Characteristics |
|---|---|---|
| July 27 (Mon) Rebound | $65,276-$65,387 | Ceasefire-driven + short squeeze, breakout above $65K on volume |
| July 28 (Tue) Asia Session | $65,000→$63,414 | Asian selloff opens -2.3%, hits 11-day low |
| July 28 Europe Session | ~$63,700-$63,800 | Recovery from lows — cautious buying ahead of FOMC |
| Current | ~$63,791 | Consolidating in $63.5K-$64K range — awaiting FOMC tomorrow |
BTC opened the Asian session by dropping from Monday's $65K+ range to $63,414 — a 2.3% decline — before recovering slightly. This is textbook "FOMC risk-shedding": Monday's rebound bulls chose to reduce positions into the FOMC opening.
BTC's rapid reversal from Monday's $65K rebound follows the seasonal pattern of "sell before FOMC, buy after." Since 2024, BTC has averaged -1.8% in the 48 hours before an FOMC decision and +3.2% in the 48 hours after.1
Why BTC is Under Pressure on FOMC Day 1
- FOMC uncertainty — 36.3% hike probability is the highest pre-FOMC since 2024; bears exploit the ambiguity
- ETF flow reversal — Monday ETF data showed $225M net outflows, categorizing the $65K bounce as a "short squeeze" rather than genuine buying
- NVIDIA crashes 5% — AI sector rout drags crypto given >80% correlation
- Profit-taking — Short-term gains from Monday's $65K rally liquidated ahead of FOMC
- Thin Asian liquidity — Low volumes amplify selling pressure
150,000 Liquidations
| Metric | Data |
|---|---|
| Total liquidated traders | 150,000+ |
| Total liquidations (24h) | $300M+ |
| Largest single order | BitMEX ETH-USDT Perpetual — $1.2M |
| ETH leads losses | -3.6% — bears focus on ETH longs |
| XRP | -4% — worst performer |
| SOL | -3.4% — following the market |
Unlike Monday's 88.7% short liquidations, July 28's liquidations were ~65-70% longs. The FOMC opening decline is fundamentally "bulls proactively reducing uncertainty risk" combined with "bears exploiting the window."2
二、🏛️ FOMC Day 1 — The Most Uncertain Rate Decision Enters 24-Hour Countdown
Latest Probabilities (July 28)
| Decision | CME FedWatch | Polymarket |
|---|---|---|
| Hold rates (3.5%-3.75%) | 63.7% | ~62% |
| Hike 25bp to 3.75%-4.0% | 36.3% | ~38% |
| Cut rates | <1% | <1% |
Citadel Predicts a Hike — Warsh's Credibility Test
Citadel Securities published a research note ahead of FOMC predicting a surprise 25bp rate hike. Their core argument:
"A hike would strengthen Chairman Warsh's credibility in fighting inflation."
Citadel argues that if Warsh maintains a hawkish posture over several months but then fails to deliver, markets may view him as "all hat, no cattle." However, all 76 economists surveyed by Bloomberg expect rates to be held steady — a rare divergence between a major market maker and economist consensus.
Trump's Pressure
On FOMC opening day, President Trump stated publicly that "the cost of living is coming down very rapidly," widely interpreted as indirect pressure on Warsh to keep rates unchanged. The ongoing standoff between Trump (pushing for rate cuts) and Warsh (maintaining hawkish posture) adds a political dimension to the decision.
Dissent Risk
| FOMC Member | Stance | Vote Expectation |
|---|---|---|
| Warsh (Chair) | Hawkish-leaning | Likely deciding vote |
| Logan (Dallas) | Explicitly pro-hike | May dissent |
| Hammack (Cleveland) | Explicitly pro-hike | May dissent |
| Majority | Data-dependent | Lean hold |
This FOMC meeting is widely seen as the most uncertain since 2024. The 36.3% hike probability priced by CME FedWatch versus the consensus expectation of a hold reflects the market's lack of familiarity with Chair Warsh's behavior pattern.3
三、🏦 BTC ETF Outflows $465M — Institutions Sell Into the Rebound
ETF Flow Data
| Event | Data |
|---|---|
| July 23-24 net outflows | $465M+ — snaps 7-day inflow streak |
| of which IBIT (BlackRock) | $415M — 89% of total |
| July 27 (Mon) net outflows | $225M |
| Weekly net inflow (to July 25) | +$33.8M — 3rd consecutive positive week but slowing |
IBIT's 89% Share of Outflows
BlackRock's IBIT alone accounted for $415M of the $465M total outflow (89%). This reveals:
- Institutions sold into the strength — The $65K+ zone is seen as an exit window
- Monday's bounce lacks ETF confirmation — $225M outflow means institutions did not chase at $65K
- Divergent institutional views — While IBIT bled, other ETFs (FBTC, BITB) saw smaller outflows or even inflows, indicating internal disagreement
The $225M ETF outflow during Monday's $65K BTC bounce represents a critical divergence signal: spot price gains were not confirmed by institutional ETF flows. If outflows continue post-FOMC, BTC faces significant downside risk.4
ETH ETF Outperforms
In contrast, ETH spot ETFs recorded $103.9M in net inflows last week, outperforming BTC ETFs. Investor preference is shifting — from "BTC only" toward "both BTC and ETH" or even pure ETH exposure.
四、📉 NVIDIA Crashes 5% — AI-Crypto Linkage Suppresses Recovery
AI Sector Rout
| Stock | Drop | Impact |
|---|---|---|
| NVIDIA | -5.17% 🚨 | Crypto-AI correlation >80% |
| AMD | -5.17% 🚨 | Chip leaders crash in tandem |
| Micron | -2.25% | Memory chip weakness |
| Philadelphia Semi Index | -2%+ | Sector-wide selloff |
Why Crypto Is Now Correlated With AI (80%+)
- Miner pivot to AI — TeraWulf's $19B Anthropic deal, CoreWeave, etc. make BTC miners AI-adjacent stocks
- RWA + DePIN narratives — Real-world asset tokenization and DePIN overlap with AI infrastructure
- Same macro drivers — Interest rates and liquidity drive both AI stocks and crypto simultaneously
Crypto's high correlation with AI means FOMC's impact on BTC is twofold — direct (risk appetite) and indirect (via AI/tech stock amplification). As long as NVIDIA keeps falling, BTC struggles to mount an effective recovery from $63K-$64K.5
五、🕊️ US-Iran Ceasefire Pushes Oil Down 8% — Positive Overshadowed by FOMC
| Time | Brent | Change |
|---|---|---|
| July 13 | ~$70 | Pre-conflict |
| July 25 | $100+ | 13-night bombing peak |
| July 27 | ~$90 | Ceasefire expectations |
| July 28 | ~$88.36 | -8% — de-escalation confirmed |
Why the Oil Drop Didn't Boost BTC
A classic case of "bullish catalyst overwhelmed by stronger bearish forces":
- Oil -8% → CPI expected to drop → theoretically bullish for risk assets
- But FOMC opens → 36% hike probability prevents market from focusing on oil
- AI crash → NVIDIA -5% drags overall risk appetite
- ETF outflows → Institutions fail to confirm $65K rebound
Three overlapping bearish factors completely overshadow oil's crypto-positive signal.
六、💎 ETH/BTC Breaks Above 200 DMA — Altcoin Rotation Signal
ETH's Unique Profile in This Selloff
Despite dropping 3.6% on July 28, a major structural signal emerged:
ETH/BTC broke above its 200-day moving average for the first time since January 2026.
| Metric | Data | Significance |
|---|---|---|
| ETH/BTC | Above 200 DMA | First time since January 2026 |
| ETH July gain | +24% | Far exceeds BTC's +10% |
| ETH 10-week high | $1,970 (July 27) | Highest since May |
| ETH ETF weekly inflow | $103.9M | Outperforms BTC ETF |
Why ETH Is Relatively Strong
- S&P/Pantera index catalyst — Digital Asset Index excludes BTC/XRP but includes ETH
- ETF advantage — ETH ETF inflows outperform BTC ETF for the first time
- ETH/BTC mean reversion — Rebounded from 0.029 to 0.03+
- DeFi narrative — AI agent security audits, record staking, ecosystem activity
- High-beta strategy — Under FOMC dovish scenarios, ETH's higher beta (+24% vs +10%) attracts rebound traders
Is This the Start of Altcoin Season?
| View | Logic |
|---|---|
| 🟢 Altcoin season is here | ETH/BTC above 200 DMA is the classic altcoin rotation signal |
| 🔴 Too early — needs confirmation | BTC dominance at ~59% vs 50-55% threshold for altcoin season |
Analysts broadly view the ETH/BTC 200 DMA breakout as a signal worth watching but requiring confirmation. True altcoin rotation requires BTC dominance to fall to ~50-55% with a dovish FOMC outcome.6
七、⚠️ This Week's Key Calendar — 2026's Most Consequential Week
| Date | Event | Impact |
|---|---|---|
| July 28 | 🏛️ FOMC Day 1 | ⭐⭐⭐⭐ |
| 🔥 July 29 | 🔥🔥🔥 FOMC Rate Decision + Warsh Presser | ⭐⭐⭐⭐⭐ |
| July 30 | June PCE Inflation + Q2 GDP | ⭐⭐⭐⭐⭐ |
| July 30-31 | Microsoft/Meta/Apple/Amazon Earnings | ⭐⭐⭐⭐ |
| July 31 | BTC Monthly Close | ⭐⭐⭐⭐ |
| This Week | ~$13-14B BTC + ETH Options Expiry | ⭐⭐⭐⭐ |
| August 7 | Congressional Recess — CLARITY Act Last Window | ⭐⭐⭐⭐⭐ |
Why This Is Arguably 2026's Most Important Week
Six major events overlapping in a single week:
- FOMC Decision — Potential surprise hike, reshaping global liquidity
- PCE Data — June core PCE could determine September FOMC trajectory
- Big Tech Earnings — MSFT, META, AAPL, AMZN combined $10T+ market cap
- $13-14B Options Expiry — BTC + ETH could amplify directional moves
- BTC Monthly Close — July likely a bearish monthly candle
- CLARITY Act Last Window — August 7 recess deadline may kill the bill
These 6 events are interlinked and mutually amplifying: FOMC → tech earnings expectations → crypto via >80% correlation → PCE validates/invalidates FOMC → options expiry accelerates direction once set.7
Scenario Analysis: 3 Post-FOMC Paths
| Scenario | Probability | BTC Target | Trigger |
|---|---|---|---|
| 📉 25bp Hike → BTC Tests $60K | ~36% | $60K-$62K | Hike + hawkish statement + ETF outflows accelerate |
| ➡️ Hold + Hawkish → Range Consolidation | ~40% | $62K-$64.5K | Neutral statement + PCE data directs next leg |
| 📈 Hold + Dovish + ETH Rotation → $65K+ | ~24% | $63K-$65K+ | Dovish statement + ETH/BTC continues breakout |
⚠️ Disclaimer: This article is for informational and educational purposes only and does not constitute financial advice. Cryptocurrency investments carry significant risk. Always do your own research and consult a financial advisor before making investment decisions.
Recommended:
📚 Further Reading: On-Chain Guide — Blockchain from Scratch — Blockchain fundamentals and on-chain data analysis tutorials
📖 Related Articles:
Footnotes:
Footnotes
-
Source: TradingView BTC/USD 4H candlestick data; CME FedWatch Tool, July 28, 2026 ↩
-
Source: Coinglass liquidation data; The Block "BTC price falls to $63K as FOMC begins", July 28, 2026 ↩
-
Source: CME FedWatch Tool; Bloomberg economist survey (unanimous hold expectation); Citadel Securities FOMC preview report, July 28, 2026 ↩
-
Source: SoSoValue BTC ETF flow data; The Block, July 23-28, 2026 ↩
-
Source: Yahoo Finance "NVIDIA stock drops 5% as AI chip selloff deepens"; TradingView BTC-NVDA correlation analysis, July 28, 2026 ↩
-
Source: TradingView ETH/BTC daily data; CoinMarketCap BTC Dominance data, July 28, 2026 ↩
-
Source: Deribit BTC+ETH options expiry data; CNBC FOMC preview, July 28, 2026 ↩