
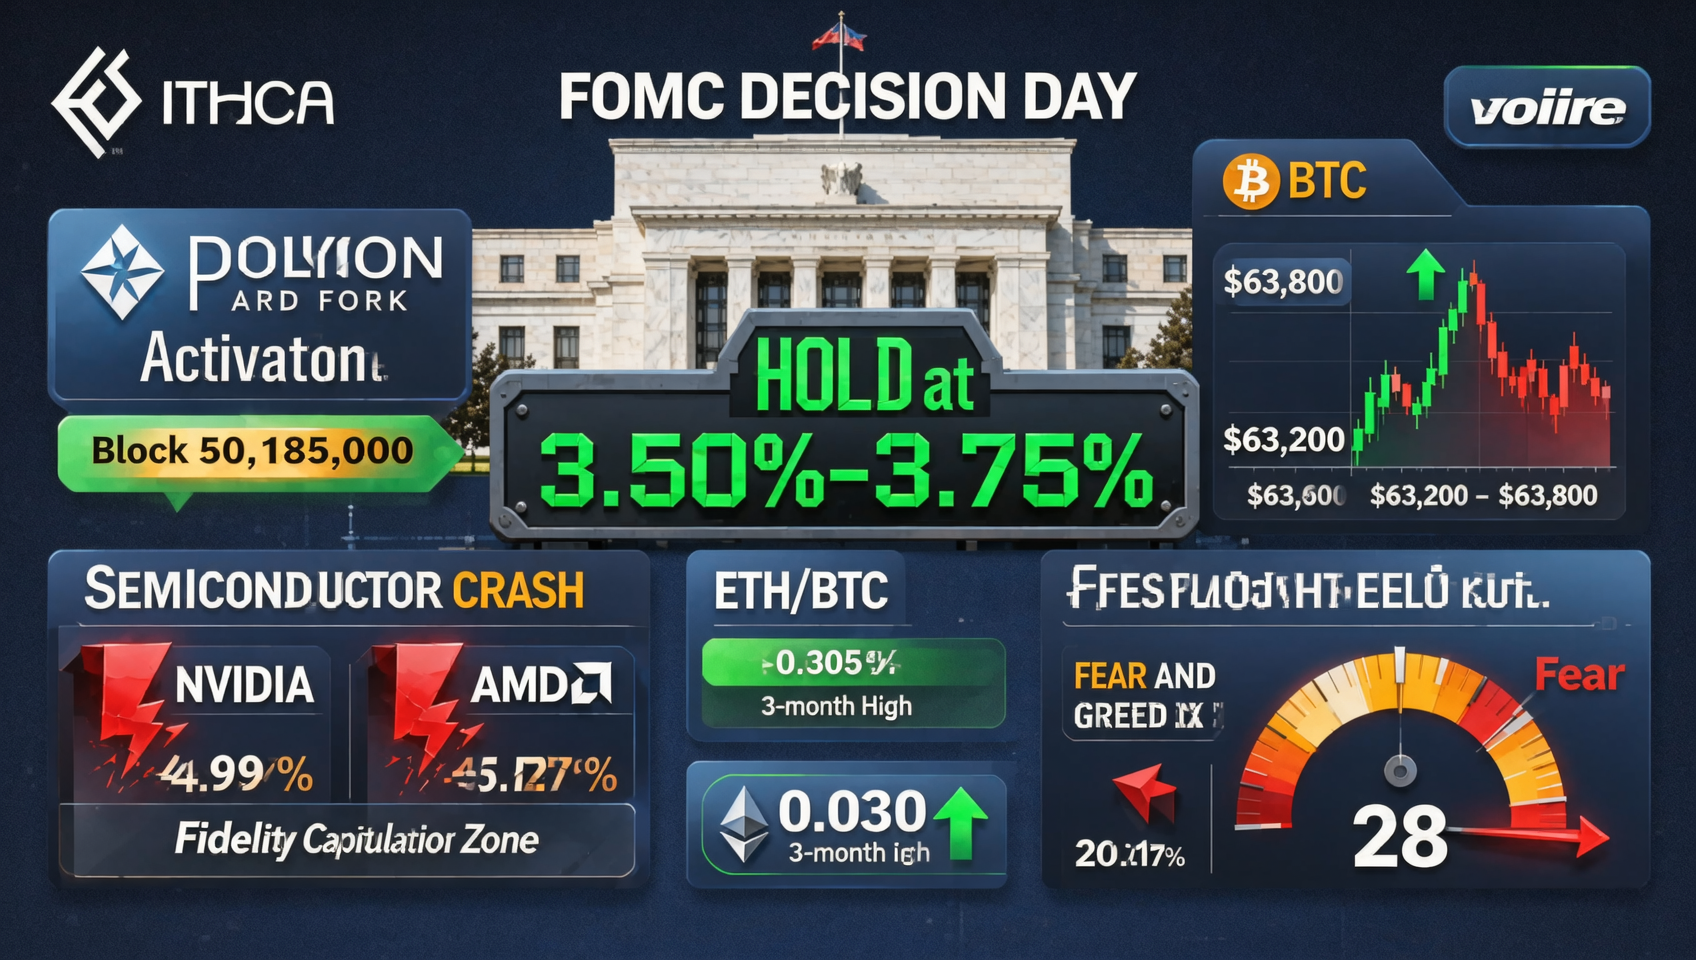
July 29: FOMC Decision Day — Fed Holds Rates at 3.50%-3.75%, Warsh Hawkish Tone Suppresses Risk Assets, BTC Pressured at $63K, Semiconductor Crash Erases $1T+, Polygon Ithaca Hard Fork Goes Live
The Fed holds rates at 3.50%-3.75% for the 5th consecutive meeting as expected, but Chair Warsh's hawkish press conference pushes September hike probability to ~80%. BTC trades in the $63,200-$63,800 range, with a brief post-announcement bounce to $63,800 fading quickly — failing to reclaim $64K. Semiconductor crash accelerates: NVIDIA -4.99%, AMD -5.17%, Philadelphia Semi Index -20%+ from highs — crypto-AI correlation (~80%) drags the market. $6.79B in global liquidations ($5.36B longs), over 160,000 traders liquidated. BTC ETFs record $465M in net outflows (IBIT 89%), institutions de-risking ahead of FOMC. ETH shows relative strength: ETH/BTC at ~0.030 (3-month high), Fidelity flags ETH in 'capitulation zone' with 70% median 1-year return signal. Polygon Ithaca hard fork activates at block 50,185,000. Fear & Greed Index at 28 (Fear) — July low. June PCE + Q2 GDP data loom tomorrow.
July 29 Crypto Market Executive Summary
| Event | Key Point |
|---|---|
| 🏛️ FOMC Holds at 3.50%-3.75% | 5th consecutive hold — Warsh's 2nd meeting chooses caution, September hike probability jumps to ~80% |
| 📉 BTC Still Under Pressure at $63K | Brief post-FOMC bounce to $63,800 fizzles, fails to break $64K |
| 📉 Semiconductor Crash — $1T+ Wiped Out | NVIDIA -4.99%, AMD -5.17% — Philly Semi Index -20%+ from highs, crypto-tech linkage drags market |
| 🟣 Polygon Ithaca Hard Fork Goes Live | Block 50,185,000 activated — payment reliability and automatic failover improvements |
| 💥 $6.79B in Global Liquidations | $5.36B in long positions wiped out — over 160,000 traders liquidated |
| 🏦 BTC ETF Outflows Continue at $465M | July 23-24 net outflows end 7-day inflow streak, IBIT accounts for 89% |
| 💎 ETH/BTC at 3-Month High | ETH/BTC ~0.030, Fidelity flags ETH in "capitulation zone" — sees long-term buying opportunity |
| 😨 Fear & Greed Index at 28 (Fear) | Market sentiment at July low — extreme caution |
| 📊 PCE + Q2 GDP Double Test Tomorrow | June core PCE expected +0.1% MoM, 3.3% YoY — will set September FOMC tone |
| 📢 MSFT/META Earnings After Close | Big Tech earnings = AI stock direction = crypto contagion |
I. 🏛️ FOMC Decision Day: Rates Held — Warsh Plays It Safe
Rate Decision (July 29, 2:00 PM ET)
The Federal Reserve announced it would hold the federal funds rate at 3.50%-3.75% following its July 28-29 meeting, marking the fifth consecutive hold since December 2025. With no updated Summary of Economic Projections or dot plot, Chair Kevin Warsh's press conference (2:30 PM ET) became the sole signal for policy trajectory.
| Decision Dimension | Data |
|---|---|
| Rate Decision | Hold at 3.50%-3.75% ✅ |
| Vote Count | TBD (Logan and Hammack may dissent) |
| Consecutive Holds | 5th (since December 2025) |
| Warsh's Tenure | 2nd meeting (took office May 2026) |
| September Hike Probability (pre-meeting) | ~80% (CME FedWatch) |
| September Hike Probability (post-meeting) | TBD |
The Fed's decision to hold represents a "safe play" by Chair Warsh in his second meeting. Against the complex backdrop of volatile oil prices from the Iran conflict and tariff-driven inflation expectations, inaction was the safest option. 1
Three Reasons for the Hold
1. June CPI Dropped 0.4% MoM
June CPI data showed headline inflation cooling from 4.2% to 3.5%, with a 0.4% monthly decline — the first monthly drop since May 2020. Falling gasoline prices (from $4.30/gal to $4.10/gal) were the main driver. While core CPI remained at 2.6%, the trend was sufficient for the majority to vote for patience.
2. 76 Economists Unanimously Expected a Hold
All 76 economists surveyed by Bloomberg expected rates to remain unchanged. Although sell-side firms like Citadel Securities predicted a 25bp hike, mainstream consensus overwhelmingly favored inaction. A rate hike against such consensus would have risked significant market turmoil and reputational damage.
3. Oil Prices Fell Back from $100 to ~$83
The US-Iran ceasefire expectation drove Brent crude from $100+ back to ~$83-88, with WTI falling below $80. Oil had been the core factor driving hike expectations higher in mid-July — when oil retreated, the urgency to hike diminished significantly.
Warsh Press Conference Highlights
Warsh delivered a cautiously hawkish tone in his 2:30 PM ET press conference:
- Inflation Assessment: Acknowledged June CPI as "encouraging" but emphasized "still far above the 2% target" — core PCE at 3.3-3.4% remains double the goal
- Energy Risk: While oil has retreated from highs, Middle East tensions "could reignite energy prices at extremely short notice"
- Tariff Impact: Trump's 10-12.5% tariffs on 60 countries "are producing measurable upward pressure on supply chain prices"
- September Guidance: Did not rule out a September hike — emphasized "every meeting is live"
- Rate Path: Refused forward guidance — consistent with his post-forward-guidance approach
Warsh's core message: "Rates unchanged today, but don't get comfortable." Markets interpreted this as a Hawkish Hold — rates unchanged but policy leaning tight. 2
Initial Market Reaction
| Asset | Post-FOMC Change | Interpretation |
|---|---|---|
| BTC | $63,200 → $63,800 (brief bounce) | Small relief rally faded quickly |
| S&P 500 | ~7,428 (+0.21%) Tue close | Waiting for tech earnings |
| 10Y Treasury | ~4.30% | Rate expectations stable |
| Dollar Index | Slight strengthening | Hawkish tone supports USD |
| Gold | $4,119/oz (+1%) | Safe haven demand |
| WTI Crude | Below $80 | Ceasefire expectations continue |
II. 📉 Semiconductor Crash — $1T+ Wiped Out
Chip Stock Meltdown Data
| Stock | July 29 Performance | From Recent High |
|---|---|---|
| NVIDIA | -4.99% to $196.51 | ~25%+ from June high |
| AMD | -5.17% to $494.95 | ~30% from high |
| Philly Semi Index (SOX) | ~20%+ from late-June high | Entered correction territory |
| Sector Mkt Cap Erased | Est. $1T+ | — |
Three Causes of the Chip Crash
- Chinese DUV Lithography Breakthrough: A state-backed manufacturer reportedly began mass-producing immersion DUV lithography machines, threatening the existing ASML-NVIDIA market structure
- AI Capex ROI Questions: Investors began questioning whether massive tech capex on AI infrastructure would translate into meaningful revenue — MSFT and META earnings would serve as the test
- SOX Overbought Correction: The index had rallied significantly in H1 2026 and the correction that began in late June accelerated on July 29
Why Crypto Gets Dragged Down
Three structural linkages connect crypto to the semiconductor crash:
- Bitcoin Miners → AI: TeraWulf's $19B Anthropic deal, CoreWeave, and Iris Energy pivoting to AI cloud — miner stocks are effectively semiconductor derivatives
- Shared Macro Drivers: Fed rate path drives both AI stocks and crypto — when the FOMC turns hawkish, both asset classes suffer
- Risk Beta Transmission: Crypto has replaced small-cap growth as the "highest beta" risk asset class — when NVIDIA drops 5% in a day, BTC dropping 2-3% has become the norm
The crypto-AI/semiconductor correlation has risen from ~40% in 2024 to ~80%+ in 2026. Even without crypto-specific bad news, the market cannot decouple as long as AI stocks keep correcting. 3
III. 🟣 Polygon Ithaca Hard Fork Goes Live
Hard Fork Details
The Polygon mainnet activated the Ithaca hard fork at block height 50,185,000 on July 29, following successful deployment on the Amoy testnet.
| Dimension | Detail |
|---|---|
| Upgrade Name | Ithaca |
| Mainnet Activation | July 29, 2026 ~14:00 UTC |
| Block Height | 50,185,000 |
| Exchange Support | Binance, CoinEx, KuCoin |
Upgrade Features
The Ithaca hard fork introduces three key improvements:
- Automatic Failover: During rare block producer stalls, the network can automatically trigger failover to keep transactions running
- Transaction Protection: New mechanisms intercept transactions that could slow down or destabilize the network
- Node Operator Visibility: Enhanced integration visibility for node operators
Major exchanges including Binance, CoinEx, and KuCoin all confirmed support, temporarily suspending POL and Polygon chain token deposits/withdrawals during the upgrade while trading remained unaffected.
Ithaca marks a significant step in Polygon's network reliability roadmap. POL holders need take no action — exchanges handle the technical transition automatically. 4
IV. 💥 $6.79B Liquidations — One of 2026's Largest
Liquidation Data Overview
| Metric | Data |
|---|---|
| Total Liquidations (24h) | $6.79B |
| Long Position Liquidations | $5.36B (79%) |
| Short Position Liquidations | ~$1.43B (21%) |
| BTC Long Liquidations | $1.34B |
| BTC Short Liquidations | ~$23.87M |
| Traders Liquidated | >160,000 |
Liquidation Source Analysis
This liquidation wave resulted from multiple converging factors:
- Pre-FOMC Leverage Accumulation: Heavy long positions accumulated during the July 27 bounce to $65K, expecting a dovish FOMC outcome
- Hawkish FOMC Tone: Warsh's hawkish press conference failed to meet dovish market expectations, triggering concentrated long liquidation
- Semiconductor Crash Contagion: NVIDIA -5% effectively signaled "risk-off" — leveraged traders were forced to deleverage
- ETF Outflow Digestion: The $465M ETF outflow data was fully absorbed on FOMC day, amplifying selling pressure
With $5.36B in long liquidations, the market had clearly accumulated excessive speculative long positions ahead of the FOMC. Warsh's hawkish hold broke those expectations — "buy the rumor, sell the fact" played out in full force. 5
V. 🏦 Institutional ETF Flows — Pre-FOMC De-Risking
BTC ETF Latest Data
| Period | Net Flow | Notes |
|---|---|---|
| July 23-24 | -$465M | Ended 7-day inflow streak |
| IBIT (BlackRock) | -$415M (89%) | Highly concentrated outflow |
| FBTC (Fidelity) | -$27.9M | 6% of total outflow |
| July 27 (Monday) | -$225M | Continued outflow during bounce |
| Weekly (thru July 25) | +$33.8M | 3rd consecutive week but slowing |
What Institutional De-Risking Signals
The BTC ETF outflows ahead of FOMC send a clear message:
- Institutions sold into the $65K bounce — the $65K+ price zone was viewed as a distribution window, not an accumulation opportunity
- IBIT outflow dominance — BlackRock's IBIT at 89% of total outflow suggests mainstream asset managers were systematically reducing exposure
- Post-FOMC direction depends on PCE — weak PCE data on July 30 could bring institutions back; hot PCE could accelerate outflows
ETH ETF Relative Outperformance
In stark contrast, ETH ETFs recorded +$103.9M in net inflows last week, outperforming BTC ETFs for the second consecutive week. BlackRock's ETHA absorbed $96.3M, while the same firm's IBIT saw $95.5M in outflows — a clear internal capital rotation signal within the same asset manager.
The structural divergence between BTC ETF outflows and ETH ETF inflows is one of the most important capital flow signals in the current market. Institutions are not exiting crypto — they are rotating from BTC to ETH. 6
VI. 💎 ETH — Relative Strength Continues
ETH Technical Snapshot
| Dimension | Data |
|---|---|
| Current Price | ~$1,875-$1,892 |
| 24h Change | -3.5% (following broader market) |
| ETH/BTC | ~0.030 (3-month high) |
| 200 DMA | ETH/BTC holds above 200 DMA |
| July Return | +24% (far exceeds BTC's +10%) |
| Weekly ETF Inflow | +$103.9M (exceeds BTC ETF) |
Fidelity Flags ETH as "Capitulation Zone"
Fidelity Digital Assets' Q3 Signal Report, released July 29, flagged ETH and SOL as approaching "capitulation zone" based on the Net Unrealized Profit/Loss (NUPL) indicator:
| Metric | ETH | Implication |
|---|---|---|
| Avg Cost Basis vs Price | -30% | All holders at average 30% loss |
| Unrealized Losses Total | ~$87B | Aggregate holder losses |
| NUPL Historical Analog | Prior similar levels → median 70% return over 1 year | Long-term buying opportunity |
Fidelity's conclusion: Current ETH valuations may present a compelling long-term entry point, though near-term macro uncertainty persists.
Altcoin Performance
| Coin | Price | 24h | Notes |
|---|---|---|---|
| BTC | ~$63,200-$63,800 | -2~3% | Failed to hold $64K post-FOMC |
| ETH | ~$1,875-$1,892 | -3.5% | ETH/BTC maintains strength |
| XRP | ~$1.06 | -4% | CLARITY Act deadlock weighs |
| SOL | ~$74 | -3.4% | Fidelity flags "capitulation zone" |
| DOGE | ~$0.071 | -3% | Following broader market |
| BNB | ~$570 | -1.5% | Relatively resilient |
VII. 📊 Tomorrow's Focus — PCE + Q2 GDP Double Test
July 30 Key Data
| Data Point | Expected | Prior | Market Impact |
|---|---|---|---|
| June Core PCE (MoM) | +0.1% | +0.3% (May) | Higher → Bearish; Lower → Bullish |
| June Core PCE (YoY) | 3.3% | 3.4% (May) | Still double the 2% target |
| June Headline PCE (MoM) | -0.1% | +0.4% (May) | Negative → disinflation signal |
| Q2 GDP Advance | TBD | -1.2% (Q1) | Negative → recession fears |
| Tech Earnings | MSFT/META | After close | AI capex reality check |
Why This Matters
With the FOMC decision behind us, markets turn to two fundamental questions:
- Is inflation cooling? — June core PCE below +0.1% MoM could pave the way for a September hold; above +0.1% would push September hike probability above 90%
- Is the economy in recession? — Q1 GDP was -1.2%. A second consecutive negative quarter would mean the US has entered a technical recession, forcing the Fed to reconsider its tightening bias
The PCE+GDP combo will determine the post-FOMC market direction. A "Goldilocks" outcome of cooling inflation + economic expansion could push BTC back above $64K. "Stagflation" of sticky inflation + contraction could drive BTC toward $60K-$62K. 7
VIII. 🗓️ Remaining Week Calendar
| Date | Event | Impact |
|---|---|---|
| 🔥 July 29 | FOMC Decision + Warsh Presser (DONE) | ✅ |
| 🔥 July 30 | June PCE + Q2 GDP Advance | ⭐⭐⭐⭐⭐ |
| July 30 | MSFT/META Earnings After Close | ⭐⭐⭐⭐ |
| July 31 | AAPL/AMZN Earnings + BTC Monthly Close | ⭐⭐⭐⭐ |
| July 31-Aug 1 | ~$13-14B BTC+ETH Options Expiry | ⭐⭐⭐⭐ |
| Aug 7 | Congressional Recess — CLARITY Act Last Window | ⭐⭐⭐⭐⭐ |
⚠️ Risk Disclaimer: This article is for informational purposes only and does not constitute investment advice. The FOMC held rates but delivered a hawkish tone suppressing risk assets. BTC remains pressured at $63K, semiconductor stocks continue crashing, ETF outflows persist, and the Fear & Greed Index at 28 is at a July low. Cryptocurrency markets are extremely volatile — please manage your risk carefully.
Recommended Exchanges:
📚 Further Reading: On-Chain Guide — Learn Blockchain from Scratch — Blockchain technology tutorials and on-chain data analysis
📖 Related Articles:
- July 28 Crypto News Deep Review
- July 28 Crypto Market Deep Analysis
- July 28 ETH ETF Institutional Rotation Analysis
Footnotes:
Footnotes
-
Source: Federal Reserve FOMC Statement, July 29, 2026; CME FedWatch Tool, July 29, 2026 ↩
-
Source: Fed Chair Kevin Warsh Press Conference Transcript, July 29, 2026; Yahoo Finance, July 29, 2026 ↩
-
Source: Yahoo Finance "NVIDIA drops 5%, Philadelphia Semi Index enters correction"; TradingView BTC-NVDA correlation analysis, July 29, 2026 ↩
-
Source: ChainCatcher "Polygon Ithaca Hard Fork Goes Live on Mainnet July 29"; Binance Announcement POL Network Upgrade, July 29, 2026 ↩
-
Source: Coinglass liquidation data, July 29, 2026 ↩
-
Source: SoSoValue BTC/ETH ETF flow data, July 29, 2026 ↩
-
Source: Bureau of Economic Analysis PCE Release Calendar; Bloomberg economist survey, July 29, 2026 ↩