
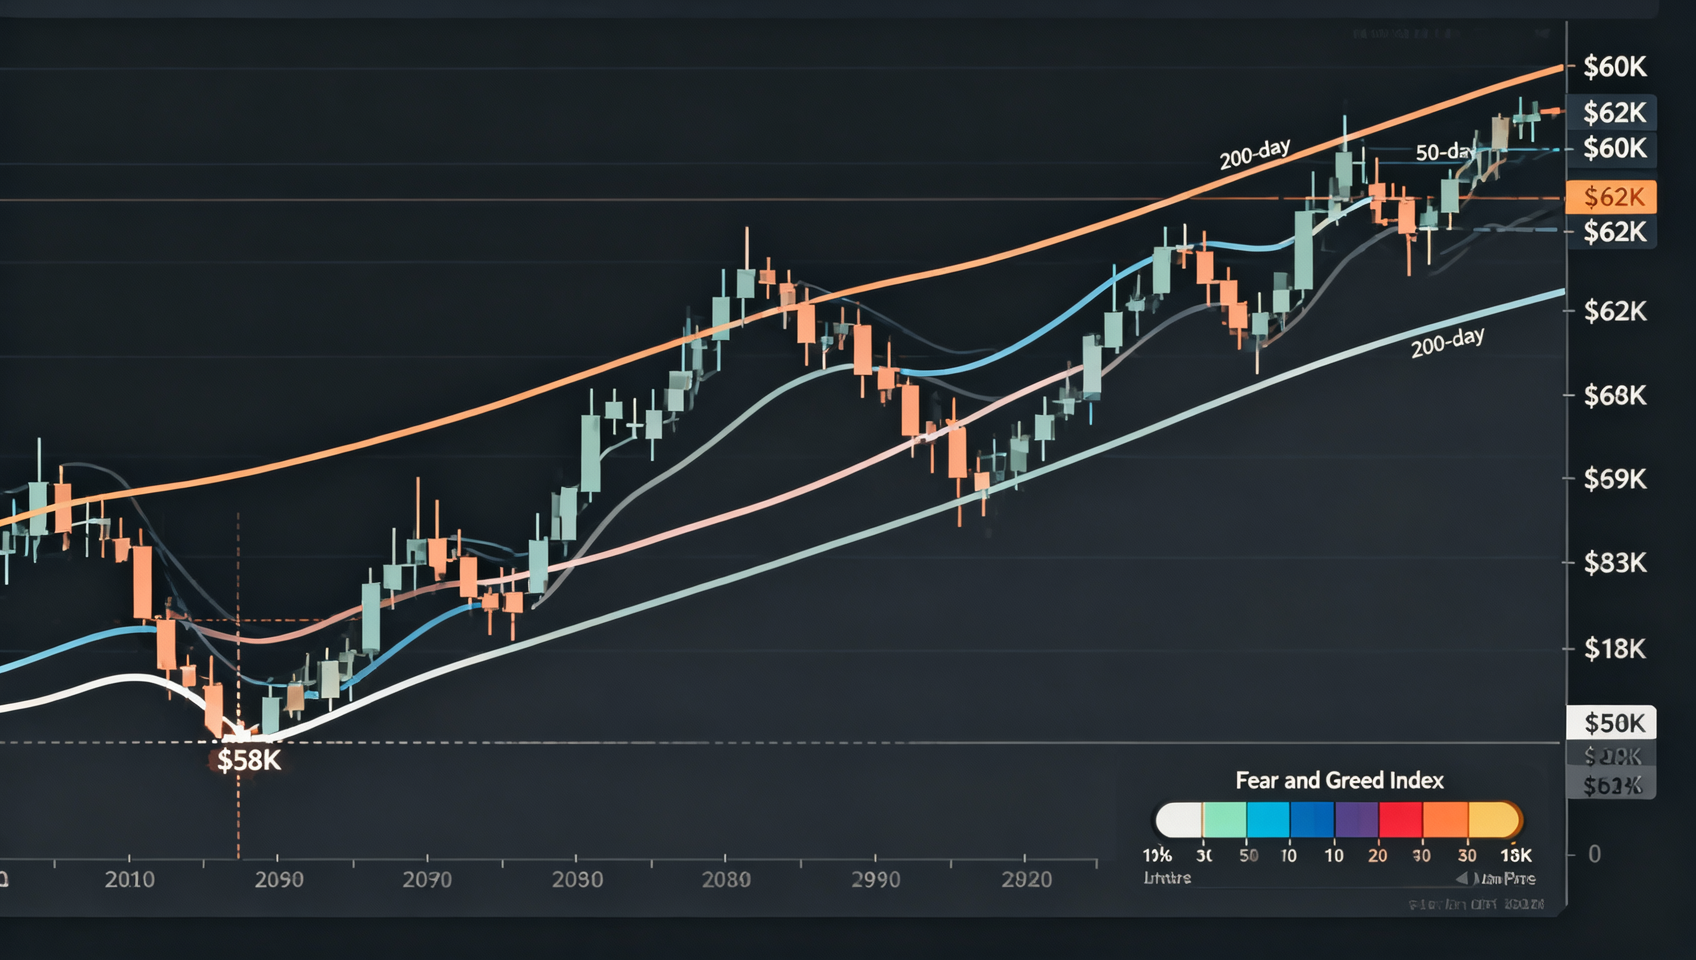
Deep Market Analysis July 2: BTC Back at $60K, TD9 Buy Signal, Bulls vs Bears at Inflection Point
Bitcoin bounces to $60,000+ after June selloff as TD Sequential triggers monthly buy signal. $58K support confirmed; $62K-$65.5K key resistance. NFP data today.
Market Overview
| Metric | Value | 24h Change |
|---|---|---|
| Total Market Cap | ~$2.04T | +1.5% |
| BTC Price | $58,670-$60,117 | +0.8%~+2.5% |
| ETH Price | $1,574 | +0.6% |
| BTC Dominance | 55.2% | -0.5% |
| Fear & Greed | 10-46 (divergent) | Recovering |
1. Bitcoin Technical Analysis
Current Status
BTC bounced back above $60,000 after June's 18.5% monthly decline. The $58,000-$58,200 zone held as support, forming a potential double bottom pattern.
TD Sequential Monthly '9' Buy Signal
The TD Sequential indicator triggered a monthly '9' buy setup for the first time since July 2022. This signal historically appeared at major BTC bottoms (March 2020 COVID crash, November 2022 FTX collapse).
Key Levels
| Level | Price | Significance |
|---|---|---|
| Resistance 3 | $65,631 | 50-month EMA |
| Resistance 2 | $62,445 | 200-week MA |
| Resistance 1 | $60,500-$61,000 | Short-term breakout |
| Current | $58,670-$60,117 | Recovery zone |
| Support 1 | $58,000-$58,200 | Double bottom neckline |
| Support 2 | $55,000-$56,200 | If $58K breaks |
| Support 3 | $52,000-$53,000 | Citi bear case |
Scenarios
| Scenario | Prob | Target |
|---|---|---|
| 🟢 Bounce continues | ~40% | $62K-$65K |
| 🟡 Range-bound | ~35% | $58K-$62K |
| 🔴 Further decline | ~25% | $55K-$52K |
2. Top 10 by Market Cap
| Rank | Coin | Price | 24h Change |
|---|---|---|---|
| 1 | BTC | $58,670 | +1.2% |
| 2 | ETH | $1,574 | +0.6% |
| 3 | BNB | $546 | +0.3% |
| 4 | XRP | $1.044 | +1.2% |
| 5 | SOL | $74.14 | -0.5% |
| 6 | HYPE | $64.69 | +1.8% |
3. On-Chain Data
ETF Flows (June Record)
- Outflows: $4.5B (record)
- IBIT share: ~$3.3B (75%)
- Citi cut inflow assumption from $10B to zero
Supply/Demand
- ETF sold: ~71,600 BTC
- Corporate bought: ~7,500 BTC
- Miners added: ~13,500 BTC
- Net oversupply: ~77,000 BTC ($4.4B)
4. Macro: NFP Today
- Prior: +172K
- Expected: ~170K
- Fed: 80% prob. September rate hike
5. Outlook
Short-term (1-2 weeks)
Market at inflection point. Key catalysts: NFP data, ETF flow reversal, $62K resistance test.
Medium-term (1-3 months)
| Scenario | Prob | Condition |
|---|---|---|
| Range-bound | ~50% | $55K-$65K |
| V-recovery | ~20% | ETF inflows + rate cut hopes |
| Continued decline | ~30% | Macro deterioration |
⚠️ Risk Disclaimer: This analysis is for informational purposes only.
Getting Started: Binance | OKX
📚 Learning Resource: What is Blockchain? Complete Beginner Guide — Blockchain fundamentals and on-chain data analysis tutorials