
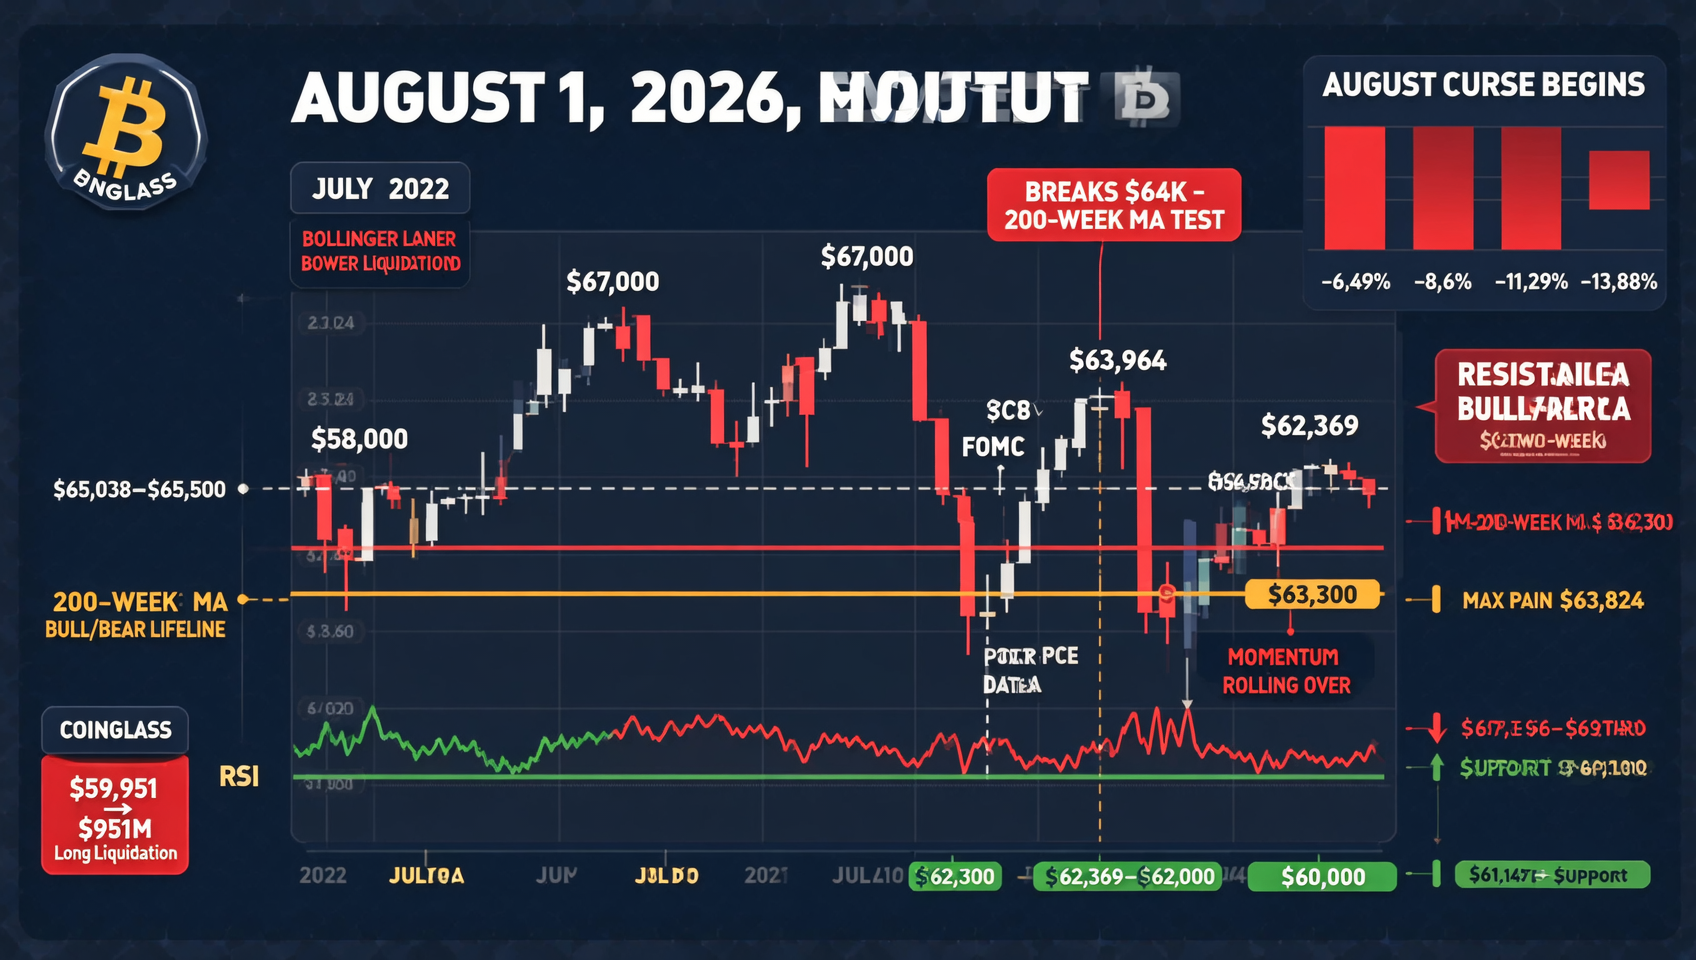
August 1 Market Analysis: BTC Breaks Below $64K Testing the 200-Week MA — $3K Flash Crash in 12 Hours to $62,369 (Two-Week Low), $100M Long Liquidations, $63.3K Bull/Bear Lifeline, Options Turn Bearish ($60K Put Hottest), ETF Inflows Fail to Underpin, August Curse Officially Begins, Coinglass Map $59,951/$66,155
BTC broke below $64K on the first day of August, flash-crashing from $65,340 to $62,369 in 12 hours — a two-week low — with a ~3% daily loss trimming July's monthly gain from ~10% to ~4.5%. Total liquidations hit ~$360M (65% longs, ~$235M); BTC longs lost $100M (4x the prior day). Coinglass shows a break below $59,951 would trigger ~$951M in long liquidations while reclaiming $66,155 would ignite ~$1.928B in short liquidations. Technically, both the $64K anchor and the options max pain of $63,824 were pierced; the 200-week MA (~$63,300) is now the bull/bear lifeline — losing it targets $61,147-$62,000 and opens a test of $60,000. RSI has rolled back over and the lower Bollinger band is expanding. Options positioning flipped from betting $70K to hedging $60K (the $60K put is the hottest position at $1.17B OI) while ETFs absorbed a net +$212.7M without stopping the leverage clearing. August seasonality (down every August for 4 years, avg ~-10%) plus analyst consensus (Cowen: $61,147 support, bottom late Sep-early Oct) form medium-term pressure. Composite score 3.5/10.
August 1 Macro Data Overview
| Metric | Value | Status |
|---|---|---|
| BTC Price | ~$62,700-$63,300 | 🔴 Broke below $64K — testing 200-week MA $63.3K — two-week low |
| ETH Price | ~$1,861 | 🔴 ~-3% — following BTC lower |
| SOL Price | ~$73 | 🔴 ~-2% — altcoins broadly down |
| XRP Price | ~$1.06 | 🔴 ~-3% — pressured by stalled CLARITY Act |
| DOGE/BNB | ~$0.069 / ~$585 | 🔴 BNB ~-3% — majors all lower |
| Fear & Greed Index | 25 (Fear) | 🔴 Down from 28 — nearing "Extreme Fear" |
| RSI (14) | Rolling back from neutral | 🔴 Momentum weakening after the $64K break |
| 200-Week MA | ~$63,300 | 🔴 Being tested now — loss opens downside |
| Total Liquidations | ~$360M (longs $235M) | 🔴 Long-dominated cascade |
| BTC Monthly Gain | Trimmed from ~10% to ~4.5% | 🔴 July's rally heavily reduced |
| ETF Flows | July 31 net inflow +$212.7M | 🟢 Institutions buy the dip — divergence with price |
| Kimchi Premium | +0.57% | 🟢 Korea sentiment improves (was -2.05%) |
一、📉 BTC Technical Analysis — Broke Below $64K, 200-Week MA Is the Lifeline
July Journey So Far
| Phase | Time | Price Range | Character |
|---|---|---|---|
| July Low | Early July | ~$58,000 | Post-June-20% crash low |
| Run to $67K | Mid-July | ~$67,000 | Monthly high — AI + Clarity tailwinds |
| FOMC Pullback | Jul 28-29 | $67K→$63.2K | Hawkish hold + ETF outflows |
| PCE Bounce | Jul 30 | $63,269→$64,964 | PCE cooling + short squeeze — touched $65,038 |
| Expiry Day | Jul 31 | $65,340→$62,369 | Intraday high then flash crash — closed $63,824 (max pain) |
| August 1 (Today) | Aug 1 | $62,700-$63,300 | Below $64K — 200-week MA $63.3K battle |
Key Price Levels
| Level | Tag | Note |
|---|---|---|
| $67,000 | 🔴 | July high — medium-term resistance |
| $65,038-$65,500 | 🔴 | July 30 rejection — confirmed resistance |
| $63,824 | 🔴 | Near options max pain — post-expiry pressure |
| $63,300 | 🔴 | 200-week MA — being tested; loss turns trend bearish |
| $62,369 | 🟡 | August 1 low — key short-term support |
| $62,000 | 🟢 | Psychological level + relief-rally base |
| $61,147-$62,000 | 🟢 | Cowen's dense order-flow band — secondary support |
| $60,000 | 🟢 | Analyst-consensus strong support — loss opens $50K |
Indicator Status
| Indicator | Current | Read | Signal |
|---|---|---|---|
| RSI (14) | Rolling lower | Back down from July 31's 40-60 neutral zone — watch for <30 oversold | 🔴 Bearish |
| 200-Week MA | ~$63,300 | Bull/bear boundary — historically holds here | 🟡 Key test |
| MAs | Short-term turning down | 5/10-day MAs bearish after the $64K break | 🔴 Bearish |
| Bollinger | Lower band expanding | Volatility expanding on the downside | 🔴 Bearish |
| Volume | Expanding on the drop | $3K flash crash on real volume — selling is real | 🔴 Needs stabilization |
The late-July 31 flash crash was technically destructive: BTC not only broke the $64K bull/bear anchor but also sliced through the options-expiry max pain of $63,824. The 200-week MA (~$63,300) is now the bull/bear lifeline — historically BTC has repeatedly found support here and bounced, but a loss would shift focus to the $61,147-$62,000 band and open the path toward $60,000.1
二、💥 Liquidation Structure — Long-Dominated Cascade
The pre-dawn August 1 decline was the mirror image of July 30's "short squeeze" — this time long leverage was systematically cleared:
| Dimension | Data | Meaning |
|---|---|---|
| Total Liquidations | ~$360M | 90,000+ traders — scale significantly larger |
| Long Share | ~$235M (65%) | Longs systematically cleared — opposite of the squeeze |
| BTC Longs | $100M | 4× the $23M liquidated a day earlier — crowded longs |
| Short Liquidations | Only ~$21M | Shorts took profit — clear directional shift |
The essence of this liquidation is the payback for July 30-31's "short squeeze rally": the PCE bounce attracted heavy chasing longs, but the rally lacked spot-volume confirmation (Glassnode had flagged spot volume at 2019 lows). When $65K failed to break, leveraged longs' stops were triggered one by one into a waterfall cascade. Coinglass' liquidation map gives the key thresholds: BTC breaking below $59,951 would trigger ~$951M in long liquidations; reclaiming $66,155 would ignite ~$1.928B in short liquidations.2
三、🟢 Options & ETFs — Institutions vs Leverage Divergence
Post-Expiry Options Structure: From "Betting Up" to "Hedging Down"
After the $9.6B July 31 settlement, Deribit's positioning shifted notably:
| Position Change | Data | Read |
|---|---|---|
| $60K Put | OI $1.17B — replaced the $70K call as the most popular | Market now hedging downside |
| $70K Call | OI fell from peak to $943M | Upside bets sharply reduced |
| $72K Call | OI down to $888M | Pre-expiry hot bet voided — bulls proven wrong |
| Aug 28 Expiry | ~$3.15B BTC options already positioned | Short-term direction priced |
| Sep 25 Expiry | ~$6.22B BTC options positioned | Medium-term reference |
The options market's shift is unambiguous: before expiry, capital was heavy on "run to $70K"; after, it quickly pivoted to "hedge down to $60K." This structural shift means downside protection demand in the $62K-$64K zone has risen sharply — reinforcing the price decline.
ETFs Buy the Dip — Institutions Absorb at Lower Levels
While leverage got cleared, institutional flows via ETFs kept coming in:
- July 31 net inflow +$212.7M (+3,397 BTC) — ending four days of outflows
- July 30 net inflow +$233.1M — BlackRock IBIT contributed 78.7%
- July cumulative ~+$437.8M — ending two months of outflows (May -$2.4B, June -$4.5B)
- 2026 YTD still ~-$47.6B — not yet positive for the year
Key divergence signal: ETFs buy the dip while leveraged longs get cleared. Institutions and leverage are on opposite sides — there is real institutional absorption near $63K, but the rally lacks a leverage amplifier. Unless institutional inflows translate into spot volume, price may keep grinding sideways at lower levels.
四、🔬 On-Chain Data — Cost Basis & Liquidation Map
| On-Chain Metric | Data | Read |
|---|---|---|
| 200-Week MA | ~$63,300 | Price now hugging it — historical bull/bear boundary |
| STH Cost Basis | ~$69,000 (late July) | Price well below — STHs broadly underwater |
| July Spot Volume | 2019 lows (Glassnode) | The rally had no volume; this drop lacks spot support too |
| Long Liquidation Map | Below $59,951 triggers ~$951M | Dense leverage zone below |
| Short Liquidation Map | Above $66,155 triggers ~$1.928B | Covering pressure zone above |
On-chain data paints a picture of "leverage vs spot divergence": spot volume stayed depressed (Glassnode's "shallowest bear market"), while the leverage market rapidly rebuilt after the PCE bounce — that is the structural root of this flash crash. Watch the $59,951 and $66,155 liquidation thresholds: they are both potential dominoes and triggers for short covering/long stops, and they will dominate near-term volatility direction.3
五、📅 August Outlook — The Curse Officially Begins
Monthly Performance Review
July had briefly printed a ~10% gain, but the expiry-day flash crash trimmed the monthly gain to ~4.5% — confirming historical seasonality:
| Year | July | August |
|---|---|---|
| 2025 | Rally | -6.49% |
| 2024 | Rally | -8.60% |
| 2023 | Rally | -11.29% |
| 2022 | +17% | -13.88% |
BTC has fallen every August for four straight years, averaging ~-10%. Midterm-election years (2014, 2018, 2022) average even worse at -13.6% (2014: -17.55%, 2018: -9.27%, 2022: -13.88%). The historical pattern (since 2013, a +8.61% median July has been followed by a -7.51% median August) matches 2026's trajectory closely — after a big July, August is replaying the "giveback" script.4
Analyst Views
| Analyst | August View | Key Levels |
|---|---|---|
| Benjamin Cowen | Midterm-year playbook — July rally gives back in Aug/Sep | Support $61,147; bottom late Sep-early Oct |
| @LP_NXT | Dip to $58K-$62K early August, then H2 recovery | Short-term bottom $58-62K; year-end $80K-$92K |
| Bearish chartists | Potential "bear pennant" — a break targets $52K-$55.3K | Breakdown risk below $62K |
| Coinglass model | Below $59,951 triggers $951M long liquidations | Thresholds $59,951/$66,155 |
Consistent with July 31's consensus ("no analyst sees August as a breakout month"), the flash crash further validates the bearish camp. The disagreement is on depth: Cowen expects a mild giveback to ~$61K; @LP_NXT sees $58K-$62K as the golden pit; chartists flag $52K-$55.3K on a pennant breakdown. The mainstream consensus remains: the true bottom is in late Sep-early Oct.
Composite Rating
| Dimension | Score | Note |
|---|---|---|
| Technical | 🟡 4/10 | Broke below $64K — 200-week MA $63.3K is the key test |
| Macro | 🟡 5/10 | PCE cooling continues — but BOJ hawkish surprise + yen volatility |
| Sentiment | 🔴 3/10 | Fear & Greed fell to 25 — nearing extreme fear |
| On-Chain | 🟡 4/10 | Spot volume depressed — institutions absorb via ETFs, leverage clears |
| Capital Flows | 🟡 4/10 | ETFs +$212.7M — but cannot stop leverage liquidation |
| Seasonality | 🔴 2/10 | August curse begins — down every August for 4 years |
| Composite | 3.5/10 | Broke $64K + long liquidations + August seasonality = triple pressure — 200-week MA decides near-term fate |
六、⚠️ Key Risks
- 200-week MA loss: an effective break of $63,300 targets $62,000/$61,147 — then opens a test of $60,000
- Leverage cleanup incomplete: below $59,951, ~$951M in long liquidations could accelerate the decline
- BOJ hawkish spillover: first inflation-overshoot warning — yen carry-trade unwinds would pressure global risk assets
- Options turn bearish: the $60K put is the hottest position — the market is systematically hedging downside
- August seasonality curse: down every August for 4 years + -13.6% midterm average — defense beats offense
⚠️ Risk Disclaimer: This is deep market analysis, not investment advice. BTC broke below $64K on August 1, dropping ~$3,000 in 12 hours to $62,369 with $360M in long liquidations; the 200-week MA at $63.3K is the bull/bear lifeline. ETFs absorbed $212.7M but could not stop leverage clearing, and the August seasonality curse is officially underway. Cryptocurrency markets are extremely volatile — manage your risk.
Recommended Registration:
📚 Extended Reading: On-Chain Guide - Blockchain from Zero — blockchain fundamentals and on-chain data tutorials
📖 Related Articles:
- July 31, 2026 Crypto Market Analysis
- July 31, 2026 Crypto News Deep Review
- July 30, 2026 Crypto News Deep Review
Footnotes:
Footnotes
-
Source: TradingView BTC/USD daily/4H technical indicators; CoinGlass price levels, August 1, 2026 ↩
-
Source: CoinGlass liquidation data; ChainCatcher/Coinglass liquidation map, August 1, 2026 ↩
-
Source: Greeks.live Deribit options structure; Glassnode weekly on-chain report, July 31-August 1, 2026 ↩
-
Source: CoinGlass historical monthly returns; Benjamin Cowen/@LP_NXT analyst views, August 1, 2026 ↩