
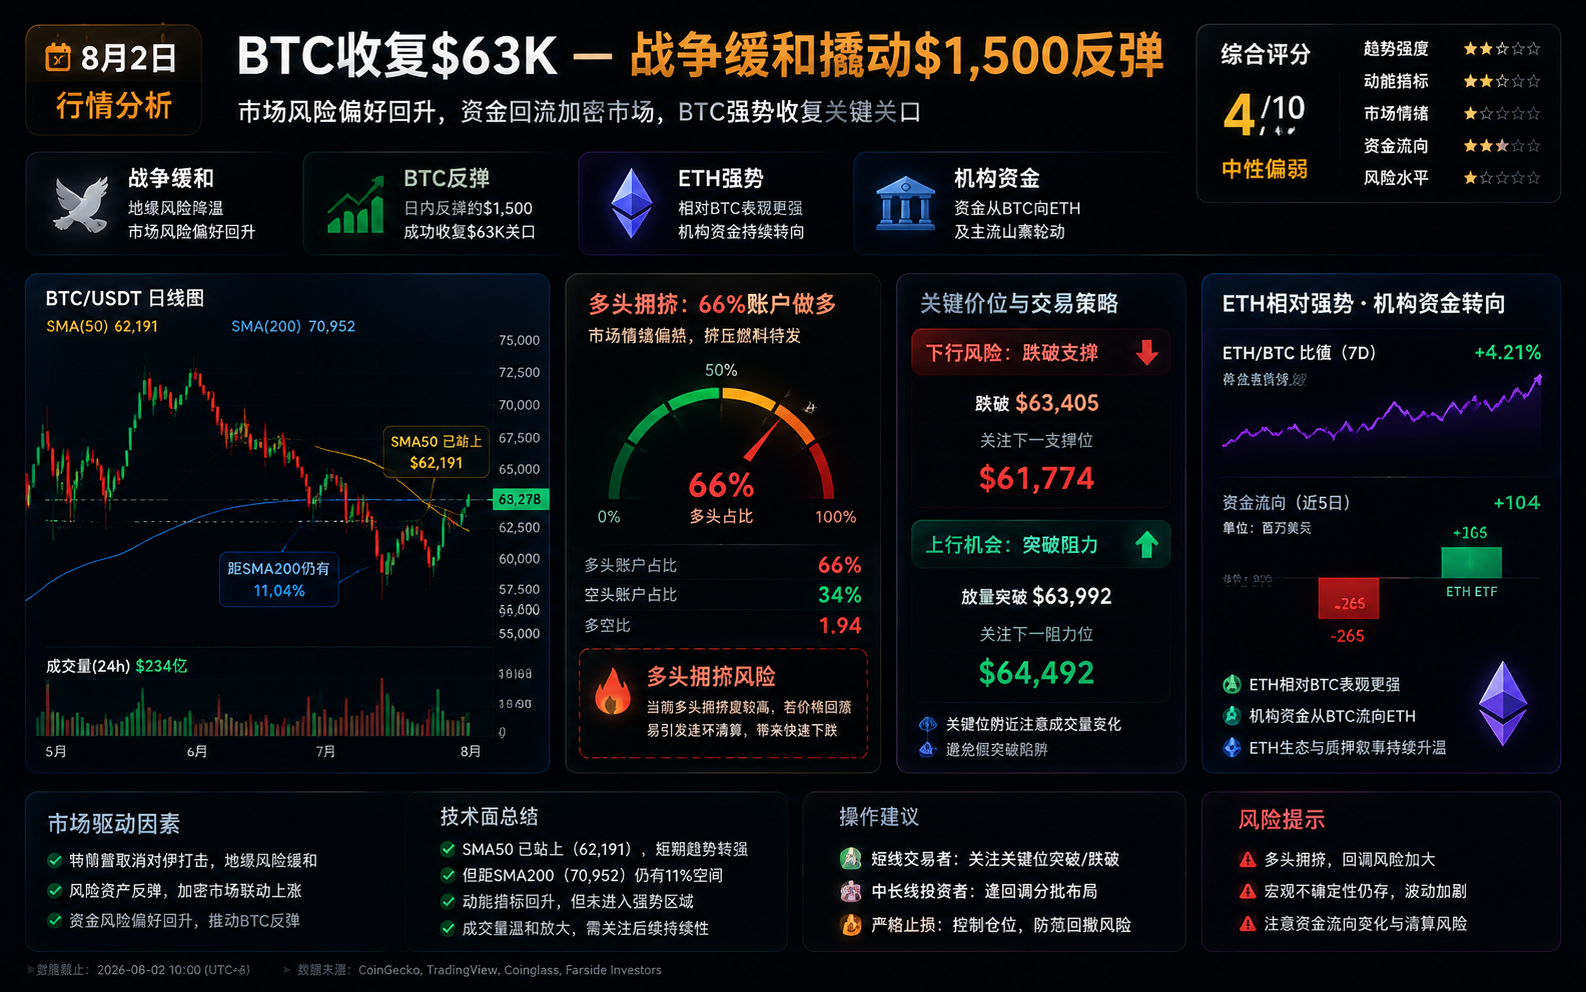
August 2 Market Analysis: BTC Reclaims $63K — War De-Escalation Fuels a $1,500 Bounce, SMA50 Reclaimed But 11% Below the 200-Day MA, Long Crowding (66% of Accounts) Loads the Squeeze, Break of $63,405 Eyes $61,774, Volume Reclaim of $63,992 Eyes $64,492, ETH Shows Relative Strength as Flows Rotate, Composite 4/10
BTC reclaimed $63K on Aug 2, catalyzed by Trump calling off Iran strikes: a ~$1,500 bounce from an 18-day low near $62,100 to ~$63,500 by Sunday morning, up ~0.65% in 24 hours, with total market cap back to ~$2.25T. Technically, BTC reclaimed the SMA50 ($63,405) and the 200-week MA (~$63,300) lifeline, but remains ~11% below the 200-day MA ($71,167); the stochastic is oversold (%K 26/%D 20) offering repair room, with RSI ~47 neutral. Futures data shows extreme long crowding — 66% of accounts long, a 0.82 taker buy/sell ratio, and OI up 1.04% to ~$6.88B — classic long-squeeze fuel: breaking $63,405/$63,133 targets $61,774-$61,000, while a volume reclaim of $63,992 targets $64,484/$64,492. 24h liquidations hit ~$257M (66.5% longs), ETH longs taking the brunt at $68.86M. ETH is showing relative strength (~$1,875, support $1,840, resistance $1,920-1,950) with ETF flows diverging (BTC -$265.4M / ETH +$9.03M) and institutions tilting buy-ETH/sell-BTC. Composite score 4/10.
August 2 Macro Snapshot
| Metric | Value | Status |
|---|---|---|
| BTC price | ~$63,400–$63,500 | 🟢 Reclaimed $63K — ~$1,500 bounce off the 18-day low near $62,100 |
| BTC 24h change | ~+0.65% | 🟢 War de-escalation lift — $1,359 intraday range |
| ETH price | ~$1,875 | 🟢 ~+1.7% — relative strength |
| Total market cap | ~$2.25T | 🟢 ~+$40B on the day |
| Fear & Greed | Still in fear zone | 🟡 Slight repair after weekend bounce — not out of the woods |
| RSI (14) | ~47 | 🟡 Neutral — balanced momentum |
| Stochastic | %K 26 / %D 20 | 🟢 Oversold — room for short-term repair |
| 200-day MA | $71,167 | 🔴 Price still ~11% below |
| 24h liquidations | ~$257M (longs $171M) | 🔴 ETH longs hit hardest |
| ETF flows | BTC -$265.4M / ETH +$9.03M | 🔴/🟢 Clear divergence |
| BTC monthly performance | ~5% below July's $67K high | 🔴 Bounce doesn't fix mid-term weakness |
| Reverse Kimchi premium | -0.62% | 🔴 Weak Korean sentiment |
1. 📈 BTC Technical Analysis — $63K Reclaimed, But Resistance Is Dense Above
This week's price evolution
| Phase | Time | Price range | Characteristics |
|---|---|---|---|
| Hawkish Fed decision | Jul 29–30 | Retreat | FOMC held 3.50%–3.75% — 3 dissents for a hike — forward guidance removed |
| Expiry-day flash crash | Jul 31 | $65,340→$62,369 | Crash after expiry — $64K broken |
| August 1 (Saturday) | Aug 1 | ~$62,100–62,200 | New US strike plans — 18-day low |
| August 2 (today) | Aug 2 | ~$63,400–63,500 | Trump calls off strikes — ~$1,500 bounce |
Key level structure
| Level | Tag | Meaning |
|---|---|---|
| $64,484 / $64,492 | 🔴 | Bollinger midband + SMA20 — bull target / strong resistance |
| $63,992 | 🟡 | Immediate resistance bulls must reclaim on volume |
| $63,405 | 🟡 | SMA50 — the only MA BTC trades above — key trigger |
| $63,133 | 🟡 | Pivot support |
| $62,633 | 🟢 | Immediate support |
| $62,100–62,200 | 🟢 | Aug 1 18-day low — confirmed support |
| $61,774 | 🟢 | Strong support — bear-target floor |
Technical indicator state
| Indicator | Current | Read | Signal |
|---|---|---|---|
| RSI (14) | ~47 | Neutral — balanced — no clear signal | 🟡 Neutral |
| Stochastic | %K 26 / %D 20 | Oversold — short-term repair room | 🟢 Bullish |
| MACD | Histogram flat near zero | Momentum missing — direction unclear | 🟡 Neutral |
| Bollinger | %B 0.236 | Price in the lower half of the band | 🟡 Neutral |
| ATR | $1,612 | Volatility still elevated — $1,600+ daily swings possible | 🔴 High vol |
Sunday's bounce reclaimed the $63K round level and the SMA50 ($63,405) — a positive sign. But the bounce needs volume confirmation: without reclaiming $63,992 on above-average volume, it remains a "thin-liquidity rebound." Just as importantly, price still sits ~11% below the 200-day MA ($71,167) — the medium-term trend has not turned. The 200-week MA (~$63,300) lifeline we flagged in yesterday's August 1 market analysis held for now.1
2. ⚖️ Bull/Bear Positioning — A "Long Squeeze" Loaded and Pointing Down
Futures data shows extreme long crowding, which is both fuel for the bounce and a source of risk:
| Futures metric | Current | Read |
|---|---|---|
| Global long/short ratio | 1.94 | Longs in the overwhelming majority |
| Account structure | 66% of accounts long | Top traders 66.3% long — "everyone is in the same trade" |
| Taker buy/sell ratio | 0.82 | Aggressive selling outpaces buying 1.22:1 |
| Open interest | ~$6.88B (+1.04%) | Price flat but OI rising — textbook long-squeeze fuel |
When most accounts are long but active buying is scarce, prices tend to get "squeezed downward" — the classic long-squeeze setup. Two scenarios: bearish — a break below the SMA50 ($63,405) and pivot ($63,133) targets $61,774–$61,000 (24–48h); bullish — reclaiming $63,992 on volume targets $64,484/$64,492.2
3. 💥 Liquidation Structure — ETH Longs Take the Brunt
24-hour liquidation data shows $257M liquidated, 66.5% longs ($171M), with ETH longs hit hardest:
| Liquidation data (24h) | Amount |
|---|---|
| Total | ~$257M |
| Long liquidations | ~$171M (66.5%) |
| Short liquidations | ~$85.54M |
| BTC longs / shorts | $31.57M / $23.54M |
| ETH longs / shorts | $68.86M / $17.65M — longs wiped out |
| Traders affected | 69,273 |
| Largest single liquidation | Binance ETHUSDT $9.21M |
ETH long liquidations ($68.86M) ran at more than double BTC longs ($31.57M) — leveraged capital prefers ETH's higher volatility. If ETH breaks $1,840 on volume Monday, the cascade extends.3
4. 🏦 ETH Showing Relative Strength — Institutional Flows Rotating
Compared with BTC, ETH looks more resilient on the flows side:
| ETH flow metric | Data |
|---|---|
| Price | ~$1,875 (+1.7%) — support $1,840 — resistance $1,920–1,950 |
| RSI | ~48 — balanced |
| ETF flows | +$9.03M July 31 — BTC ETFs -$265.4M over the same session |
| Institutional moves | Morgan Stanley MSSE staking ETF (0.14%) — Fidelity moves 260K ETH to custody |
| Exchange net flows | 6 straight days of outflows — coins leaving, not arriving |
| Distance from ATH | Still >60% below the Aug 2025 peak of $4,946 |
The "buy ETH, sell BTC" tilt from institutions is worth noting: the MSSE staking narrative (see Ethereum's staking docs) plus Fidelity's custody rebalancing suggest ETH is picking up a new institutional allocation logic. But a 60% drawdown also means heavy overhead supply.4
5. 🎯 Scenarios and Analyst Views
| Scenario | Trigger | Target | Probability |
|---|---|---|---|
| Bullish | Reclaim $63,992 on volume | $64,484 / $64,492 | 🟡 Neutral |
| Bearish | Break $63,405 → $63,133 | $61,774–$61,000 (24–48h) | 🟡 Neutral |
| Deep bearish | Break $61,774 | Opens a test of $60,000 | 🔴 Weak |
- Geopolitical catalyst: Trump calling off Iran strikes is the weekend's core driver — substantive progress in negotiations on Monday would sustain risk appetite; Bloomberg's crypto desk lists it as this week's key variable
- Macro headwind: the July FOMC held rates hawkishly (3 dissents for a hike) and CME FedWatch shows >80% odds of a September hike — high rates keep compressing risk-asset valuations
- Seasonality: August has historically been weak (BTC fell every August for the past four years) — this bounce looks more like "repair" than "reversal," with historical context in Messari's research portal
Composite rating
| Dimension | Score | Notes |
|---|---|---|
| Technicals | 🟡 4/10 | $63K and SMA50 reclaimed — but 11% below the 200-day MA — bounce unconfirmed |
| Macro | 🟡 4/10 | Geopolitical tailwind — but hawkish Fed + Sept hike odds cap upside |
| Sentiment | 🟡 4/10 | Weekend bounce lifts mood — but still in fear — -0.62% reverse Kimchi |
| On-chain | 🟡 4/10 | Fidelity custody rebalancing neutral — spot volume not expanding |
| Flows | 🔴 3/10 | BTC ETFs -$265.4M vs ETH +$9.03M — structurally split |
| Seasonality | 🔴 3/10 | Weak August history — bounce may be a repair |
| Composite | 4/10 | A de-escalation rebound window — but long crowding + hawkish Fed + August seasonality cap the upside |
6. ⚠️ Key Risks
- Geopolitical whiplash: the strike cancellation is conditional on "rapidly making a deal" — a breakdown would trigger a violent reversal
- Long squeeze: 66% of accounts long + rising OI — a break below $63,405 risks accelerated downside
- Hawkish Fed: >80% odds of a September hike — the rate headwind persists
- ETF outflows: $265.4M left BTC ETFs on July 31 — flows are turning negative
- Weekend liquidity: the bounce rests on thin liquidity — Monday's open may reverse the direction
⚠️ Risk warning: This is deep market analysis, not investment advice. Trump calling off Iran strikes helped BTC reclaim $63K over the weekend with oversold-repair signals, but long crowding, a hawkish Fed, and August seasonality cap the upside. Crypto markets are highly volatile — manage your risk carefully.
Recommended sign-ups:
📚 Further reading: On-chain Guide – Learn Blockchain from Scratch — blockchain fundamentals and on-chain data tutorials
📖 Related reads:
- August 1, 2026 Crypto Market Deep Analysis
- August 1, 2026 Crypto News Review
- July 31, 2026 Crypto Market Deep Analysis
Footnotes:
Footnotes
-
Source: TradingView BTC/USD daily/4H technicals; blockchain.news level model, Aug 2, 2026 ↩
-
Source: Coinglass futures positioning & taker data; blockchain.news long-squeeze analysis, Aug 2, 2026 ↩
-
Source: ChainCatcher/Coinglass liquidation data, Aug 2, 2026 ↩
-
Source: Farside ETF flow data; Onchain Lens on-chain tracking, Jul 31–Aug 2, 2026 ↩