
Deep Market Analysis July 18: BTC Consolidates at $63K-$64K Under Dual Pressure — CLARITY Act Passage Odds Crash to 31% Record Low, Semiconductor Bear Market Spills Over, Whales Accumulate 270K BTC vs $432M Liquidation, ETH Holds $1,830-$1,860 on Fragile Support, Japan 20% Tax Reform Structural Tailwind
Bitcoin consolidates in a weak $63,000-$64,030 range, down ~1.5% in 24 hours. Yesterday's CLARITY Act hearing with zero Democratic attendance sent prediction market passage odds to a record low of 31%-32%, rapidly extinguishing the regulatory optimism that had built over recent weeks. Tech stocks crash (Philadelphia Semiconductor Index enters bear market, Micron down >30%) and US-Iran conflict escalation (7th night of airstrikes, Brent crude above $85) form a dual overhead pressure. ETH trades at $1,830-$1,860 with two consecutive days of ETF inflows but failing to reclaim the $1,900 resistance. Counterbalancing positives: whales accumulated over 270,000 BTC in two weeks (exchange balance ratio at 6.42% all-time low), Japan's cabinet passed a 20% crypto tax reform bill. $432M in 24h liquidations (80% longs). Fear & Greed Index at 25-27 (Extreme Fear).
Market Overview
| Metric | Value | 24h Change |
|---|---|---|
| Total Market Cap | ~$2.16T | 📉 -1.5% |
| BTC Price | $63,000-$64,030 | 📉 -1.5% |
| ETH Price | $1,830-$1,860 | 📉 -2.2% |
| SOL | ~$76 | 📉 -1.8% |
| XRP | ~$1.08 | 📉 -1.1% |
| BNB | ~$574 | 📉 -0.9% |
| ADA | ~$0.183 | 📉 -1.6% |
| DOGE | ~$0.073 | 📉 -0.8% |
| BTC Dominance | ~57.9% | 📈 Slight increase |
| Fear & Greed Index | 25-27 (Extreme Fear) | Down from 33 |
| 24h Volume | ~$48B | Shrinking consolidation |
| VIX | ~20.5 | ⬆️ Elevated |
| DXY | ~100.75 | 📈 Dollar strengthens |
| Brent Crude | $85+ | 📈 Weekly +11% |
I. BTC Technical Analysis: $63K-$64K Consolidation Under Dual Pressure
Current Action
BTC trades in a weak $63,000-$64,030 range, down approximately -1.5% in the last 24 hours. After rallying from $57,950 (July 1 low) to $65,383 (July 16 PPI-day high, +13%), BTC has been steadily declining over the past 48 hours, now ~2.5% below peak.
| Metric | Detail |
|---|---|
| July low | $57,950 (Jul 1) |
| Rally peak | $65,383 (Jul 16, PPI day) |
| Rally magnitude | ~12.8% |
| Jul 17 (hearing day) high | $64,880 |
| Current | $63,000-$64,030 |
| Peak pullback | ~2.5% |
| 24h volume | ~$48B (contracting) |
Technical Indicators
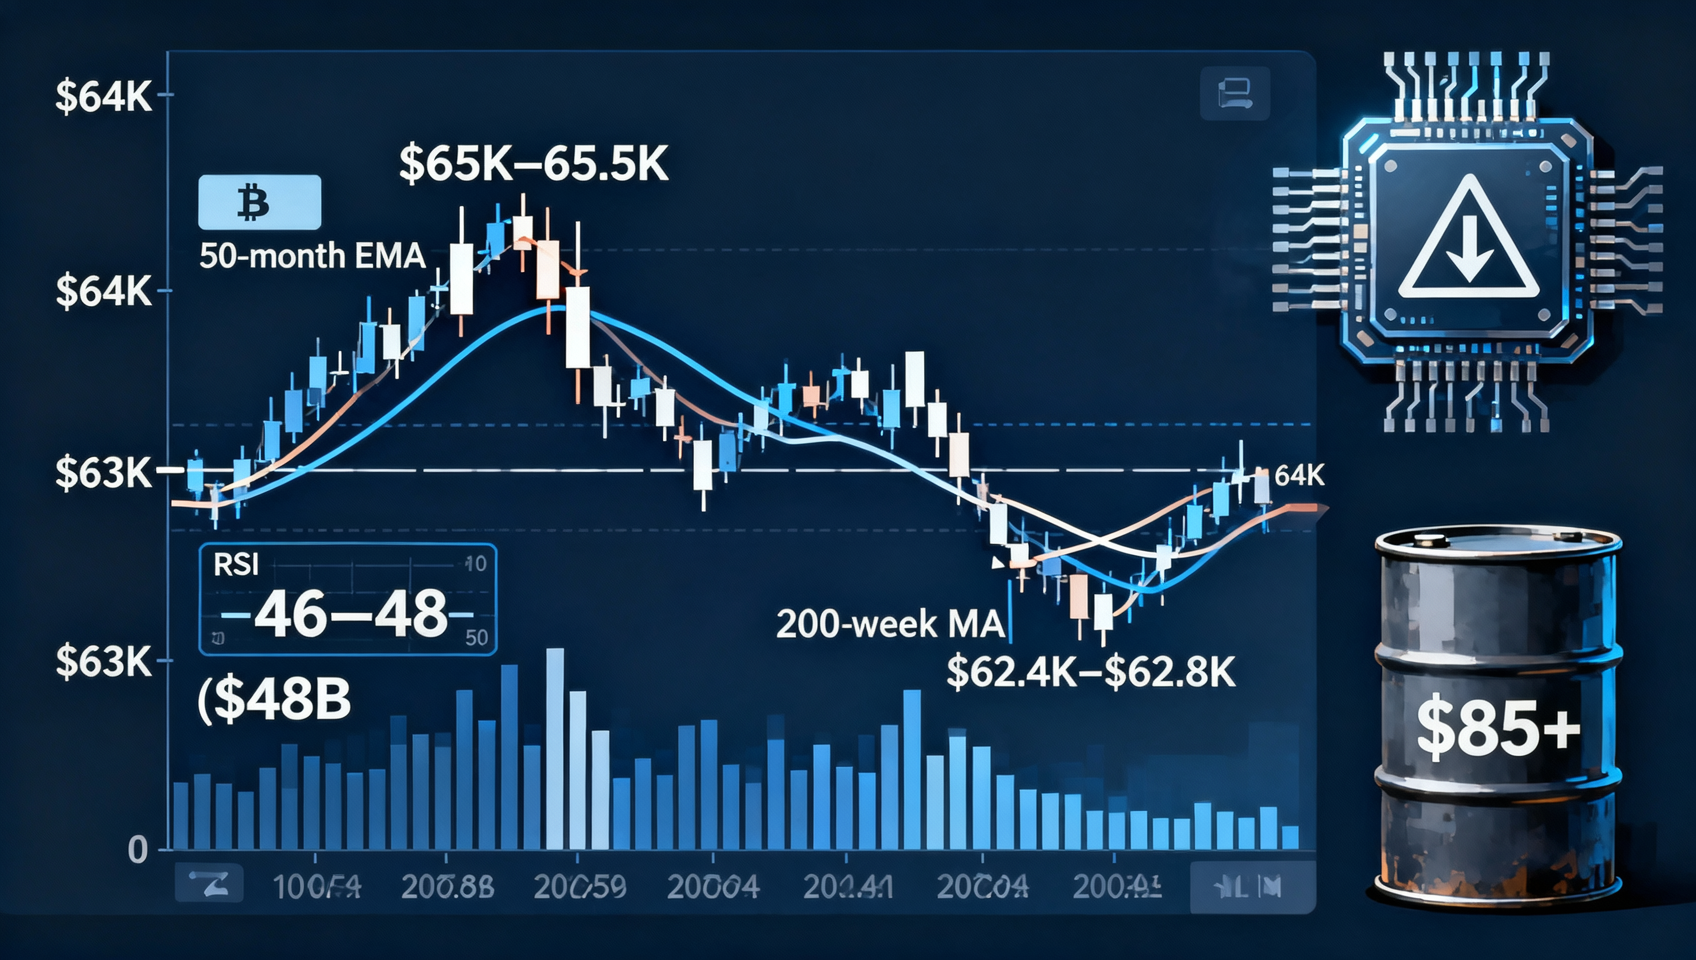
RSI (Relative Strength Index): ~46-48 — has fallen below the 50 neutral line, a clear retreat from the 50-53 range seen on July 15-16. RSI below 50 signals short-term bullish momentum has largely exhausted. If RSI falls further below 44, it would trigger a technical sell signal.
MACD: The histogram is contracting rapidly — long-side momentum is decaying. If the fast line crosses below the slow line (MACD death cross) within 1-2 sessions, it would trigger additional technical selling.
Moving Averages:
| MA | Level | Status | Significance |
|---|---|---|---|
| 20-day MA | ~$62,800 | ✅ Above | Short-term core support, rising |
| 50-day MA | ~$66,500 | ❌ Below | Mid-term resistance, descending |
| 100-day MA | ~$68,200 | ❌ Below | Further resistance |
| 200-week MA | $62,445 | ✅ Above (only ~$500 away) | Mid-term floor, buffer narrowing |
| 200-day MA | ~$74,500 | ❌ Below | Ultimate technical target |
| 50-month EMA | ~$65,300 | ❌ Below (double top failure) | Trend-reversal key — failed twice |
MA System Key Signals:
- 20-day MA ($62,800) vs 200-week MA ($62,445): Only $355 apart — an extremely compressed support cluster. A break below $62,800 almost certainly tests $62,445
- 50-day MA ($66,500) descending: Bearish mid-term alignment remains unbroken
- 50-month EMA ($65,300) double top: Two failed breakout attempts on Jul 15 and Jul 16 form a bearish double-top pattern
Volume Analysis:
- Current $48B volume is down from $65B+ at CPI/PPI peaks — contracting volume during pullback is relatively healthy (not panic selling)
- ⚠️ Risk: if volume contracts much further below $40B, market participation becomes critically low
- ❌ Risk: a volume spike >$55B with red candles would signal distribution
Key Levels:
| Level | Price | Significance |
|---|---|---|
| Resistance 4 | $73,000-$74,500 | 200-day MA |
| Resistance 3 | $68,200-$70,000 | 100-day MA + psychological |
| Resistance 2 | $66,500-$67,000 | 50-day MA |
| Resistance 1 | $65,300-$65,500 | 50-month EMA (double top) |
| Current | $63,000-$64,030 | Consolidation zone |
| Support 1 | $62,800-$63,000 | 20-day MA + round number |
| Support 2 | $62,445 (200-week MA) | Core mid-term floor |
| Support 3 | $60,000-$61,000 | Final bull line |
Scenario Probabilities (July 18)
| Scenario | Prob | BTC Target | Trigger |
|---|---|---|---|
| 📈 $63K holds → bounce to $65K-$66K | ~35% | $65K-$66K | CLARITY compromise + tech stabilization + ETF flows sustained |
| ➡️ $62K-$64K range consolidation | ~45% | $63K±$1K | No clear catalyst, wait for FOMC |
| 📉 Break below $62K to $60K-$61K | ~20% | $60K-$61K | CLARITY stalls + Iran escalation + Fed hawkish |
Change from Jul 17: "Downside" probability cut from 25% to 20%, "consolidation" from 50% to 45%, "bounce" raised from 25% to 35%. Reason: Japan tax reform + whale accumulation + possible tech oversold bounce. However, CLARITY deterioration offsets part of the positive shift.
II. Major Altcoin Analysis
Top 10 Market Cap
| Rank | Coin | Price | 24h Change | 7d Change |
|---|---|---|---|---|
| 1 | BTC | $63,000-$64,030 | -1.5% | ~+4% |
| 2 | ETH | $1,830-$1,860 | -2.2% | ~+5% |
| 3 | USDT | $1.00 | Flat | Flat |
| 4 | BNB | ~$574 | -0.9% | +1% |
| 5 | USDC | $1.00 | Flat | Flat |
| 6 | XRP | ~$1.08 | -1.1% | +2% |
| 7 | SOL | ~$76 | -1.8% | +3% |
| 8 | TRX | ~$0.329 | -0.2% | +0.5% |
| 9 | ADA | ~$0.183 | -1.6% | +4% |
| 10 | DOGE | ~$0.073 | -0.8% | +1% |
Ethereum (ETH) — $1,830-$1,860, Fragile Support
ETH at $1,830-$1,860, down ~2.2% — slightly underperforming BTC. ETH's earlier relative strength (weekly +11%) has faded as market-wide weakness dominates.
| Metric | Value | Status |
|---|---|---|
| Current Price | $1,830-$1,860 | 24h -2.2% |
| Key Support | $1,776-$1,806 (50-day EMA) | ✅ Holding |
| Resistance | $1,900-$1,946 | ❌ Below |
| ETH/BTC | ~0.0290 | Pulling back from 0.0295+ |
| RSI (14d) | ~45 | Neutral-bearish |
| ETH ETF | $36.7M net inflow | 2nd consecutive positive day |
| ETH Staked | 40.93M (ATH) | 🟢 Long-term bullish |
SOL — $76, ETF Hype Fading
SOL at $76, down -1.8%, underperforming. The Morgan Stanley SOL ETF application boost has largely faded. No new near-term catalysts.
XRP — $1.08, Regulatory Sensitivity
XRP at $1.08, down -1.1%. As one of the most regulatory-sensitive top coins, CLARITY Act deterioration directly impacts XRP.
III. Macro Environment
🟢 Bullish Factors
1. Japan's 20% Crypto Tax — Major Structural Tailwind
Japan's cabinet passed crypto tax reform from max 55% to flat 20% on July 18. The impact will compound over time: compliance capital → reduced selling pressure → competitive pressure on other countries.
2. Whale Accumulation at Record Pace
| Whale Behavior | Amount | Significance |
|---|---|---|
| 2-week cumulative | ~270,000 BTC | Fastest accumulation in months |
| Tether-linked entity | >100,000 BTC | Stablecoin issuer BTC reserve |
| Latest transaction | +1,001 BTC | Single whale continues buying |
| Exchange balance ratio | 6.42% (ATH low) | Supply scarcity intensifies |
3. ETF Flow Improvement
CoinShares reported the week ending July 17 ended an eight-week, $8B outflow streak. Total weekly net inflows: ~$1.03B (BTC $287M + ETH $84M).
🔴 Bearish Factors
1. CLARITY Act Outlook Deterioration — Most Significant Change
| Date | Passage Odds | Change |
|---|---|---|
| Late June | ~70% | — |
| Jul 16 | ~43% | ⬇️ |
| Jul 17 post-hearing | ~31% | ⬇️ All-time low |
Democratic absence at the hearing was worse than market expectations — deep partisan divide confirmed.
2. Semiconductor Index 20% Crash — Tech Contagion
SOX entering bear market directly impacts crypto via the high BTC-Nasdaq correlation (0.65-0.75 in the ETF era).
3. Iran Conflict — Oil at $85+
US airstrikes, 7th consecutive night. Brent crude above $85, up 11% weekly — a medium-term inflation risk that could undermine CPI/PPI tailwinds.
Market Assessment Matrix
| Dimension | Assessment | Trend (vs Jul 17) |
|---|---|---|
| Technical (short-term) | 🟡 Neutral — $63K-$64K, RSI 46-48 below 50 | 📉 Weakening |
| Technical (mid-term) | 🟡 Neutral — 200-week MA holds | ➡️ Holding |
| Capital flows | 🟢 Bullish — whale accumulation, ETF turn positive | ➡️ Sustained |
| Macro | 🟡 Mixed — Japan tax vs oil $85+ | ⬆️ Japan positive |
| Regulatory | 🔴 Bearish — CLARITY 31% record low | 📉 Significant deterioration |
| Geopolitical | 🔴 Bearish — Iran conflict 7th night | ➡️ Sustained |
| Whale behavior | 🟢 Bullish — 270K BTC, exchange balance 6.42% | ⬆️ Intensifying |
IV. On-Chain Data Deep Dive
Core Metrics
| Metric | Value | Status | Trend |
|---|---|---|---|
| NUPL | ~0.10 (Anxiety→Optimism) | Down from 0.13 on Jul 16 | 📉 Slight decline |
| Supply in Profit | ~46% | Down 3% from Jul 16 (49%) | 📉 Declining with price |
| Exchange Balance Ratio | ~6.42% | Continuing decline, ATH low | 📈 Increasing scarcity |
| Exchange Balance (BTC) | ~1.28M BTC | Continuing decline | 📈 Extreme scarcity |
| STH Unrealized Loss | ~12% underwater | Expanding from 10% (Jul 16) | ⚠️ Selling risk rising |
| Funding Rate | ~-0.002% | Slightly bearish | 📉 Bears in slight control |
| Quarterly Basis (annualized) | ~4.5% | Down from 5.0%, still healthy | ➡️ Neutral-positive |
| Network Hashrate | All-time high | Growing | 🟢 Network security |
Key On-Chain Insights
1. Supply in Profit at 46% Comparable to late 2025 bear market bottom levels — about 54% of BTC holders are underwater.
2. Exchange Balance 6.42% — All-Time Low Only ~1.28M BTC remains on exchanges for trading. Self-custody ratio: 93.58%. This reduces the probability of a major crash but doesn't guarantee an upward move — it's a necessary but not sufficient condition for a bull market.
3. STH Unrealized Loss Widening to ~12%
Short-term holders (hold <155 days, average cost ~$74,900) are now sitting on $11,900 unrealized loss per coin (-15.9%). If BTC falls below $62K, STH losses would exceed 17%, triggering more stop-loss selling.
4. Whale Accumulation Continues On July 18 alone, a whale added 1,001 BTC (~$6.4M). The same whale had previously purchased >$290M in BTC via OTC. Tether-linked entities have accumulated >100K BTC. This level of institutional-sized accumulation historically precedes mid-term price bottoms.
Derivatives Market
| Metric | Value | Status | Signal |
|---|---|---|---|
| BTC Perpetual Funding Rate | ~-0.002% | ⚠️ Slightly bearish | Bears have slight edge |
| Quarterly Basis (annualized) | ~4.5% | ✅ Healthy | Down from 5.0% |
| Options 25-Delta Skew | ~2% (slight call premium) | ➡️ Neutral | Call demand weakening |
| BTC Perpetual OI | ~$48B | 📉 Down from peak | Leverage reducing |
| 24h Liquidations | $432M (80% longs) | ⚠️ Longs punished | Leverage flush |
V. Outlook & Trading Strategy
Remaining Key Events
| Date | Event | Impact | BTC Direction |
|---|---|---|---|
| Jul 18-19 | Weekend consolidation — watch $63K | ⭐⭐⭐ | Range-bound |
| ~Jul 20 | 🔥🔥🔥 CLARITY Senate vote window | ⭐⭐⭐⭐⭐ | Decisive |
| Jul 28-29 | 🔥🔥🔥 FOMC July rate decision | ⭐⭐⭐⭐⭐ | Mid-term direction |
| Jul 30 | Strategy Q2 earnings | ⭐⭐⭐ | BTC holdings update |
Three Scenario Trading Strategies
Scenario 1: $63K Holds → Bounce to $65K-$66K (~35% probability, up)
Japan tax reform + whale accumulation + possible tech oversold bounce push BTC to retest $65K.
Confirmation signals:
- BTC holds $62,800 (20-day MA) and rebounds above $64,000 with volume
- 50-month EMA ($65,300) retested for a third attempt
- ETF inflows maintain >$100M/day
- CLARITY Act shows compromise signal
Strategy:
- Light long at $63,000-$63,500, stop at $62,200
- First take-profit: $65,000-$65,500
- If $65,500 breaks, second target: $67,000-$68,000
- Monitor ETH: if $1,800 holds and ETH/BTC recovers, deploy ETH position
Scenario 2: $62K-$64K Range Consolidation (~45% probability)
No major catalyst, CLARITY deadlock continues, market passively waits for FOMC.
Strategy:
- Range trade: buy $62,500 / sell $64,500
- Keep total position under 35%
- If SOX continues falling, reduce to 25%
- Japan tax theme: light position, wait for price confirmation
Scenario 3: Break Below $62K → $60K-$61K (~20% probability, down)
CLARITY explicitly blocked + Iran escalation + US stocks continue crashing.
Strategy:
- If BTC breaks $62,000, wait and watch — no buying until $60,000-$61,000 area
- $60K is psychological + Nov 2025 prior high — if it breaks, next support ~$55K-$58K
- Reduce position to <20% before FOMC
- If holding, add at $60,000 (stop $58,500)
Rally-to-Correction Timeline
| Date | BTC Price | Event | Cumulative Change |
|---|---|---|---|
| Jul 1 | $57,950 | 21-month low | — |
| Jul 10 | $64,524 | 200-week MA confirmed | +11.3% |
| Jul 15 | $65,055 | CPI miss → $65K | +12.2% |
| Jul 16 | $64,800-$65,383 | PPI miss but $65K not held | +11.8-12.8% |
| Jul 17 | $63,367 | Hearing: Democrats absent → BTC drops | +9.4% |
| Jul 18 | $63,000-$64,030 | Dual pressure + regulatory headwind | +8.7-10.5% |
Key Takeaways (July 18)
The market is in a tug-of-war between positive structural factors and negative near-term catalysts:
Technical:
- ✅ 20-day MA ($62,800) still holds — short-term support functional
- ✅ 200-week MA ($62,445) holding for day 9 — mid-term bottom structure intact
- ⚠️ RSI below 50 — short-term momentum weakening
- ⚠️ 50-month EMA double top — bears have a technical argument
- ⚠️ 20-day MA and 200-week MA only $355 apart — narrow support cluster
Macro:
- 🟢 CPI/PPI double miss confirmed macro bottom
- 🟢 Japan 20% crypto tax — long-term structural positive
- ⚠️ Iran conflict + Brent $85+ — medium-term inflation risk
Capital Flows:
- 🟢 Whales 270K BTC in 2 weeks — record accumulation
- 🟢 Exchange balance 6.42% ATH low — supply scarcity
- 🟢 BTC+ETH ETF end 8-week outflow streak
- ⚠️ Social media at 2020 lows — retail absent
Most critical market observation:
The 70%→31% collapse in CLARITY Act passage odds is the most impactful change in the past 48 hours. Democratic absence at the hearing reveals a deeper partisan divide than markets had priced. This extends the timeline for any "regulatory bull market" thesis significantly.
Simultaneously, the 270K BTC whale accumulation in two weeks represents the strongest bullish signal in the market — "smart money" is accumulating at the fastest pace of 2026. This pattern of "price-whale divergence" appeared in Q3 2024 and Q1 2025 — in both cases, prices followed whales higher within 3-4 weeks.
For traders: control leverage, be patient, wait for catalysts. The $63K-$64K breakout direction will be determined by one of: CLARITY Act reversal (unlikely), FOMC dovish signal (likely), or tech stock stabilization (medium probability).
⚠️ Risk Disclaimer: This analysis is for informational purposes only and does not constitute investment advice. The crypto market is highly volatile. Please manage your risk carefully, control leverage, and maintain appropriate position sizing.
Recommended: Binance Registration | OKX Registration
📚 Further Reading: On-Chain Guide - Learn Blockchain from Scratch
📖 Related: