
July 21 Market Analysis: BTC Structurally Fragile — Triple $65K Rejection, Spot Demand -170K, Citi Cuts to $82K
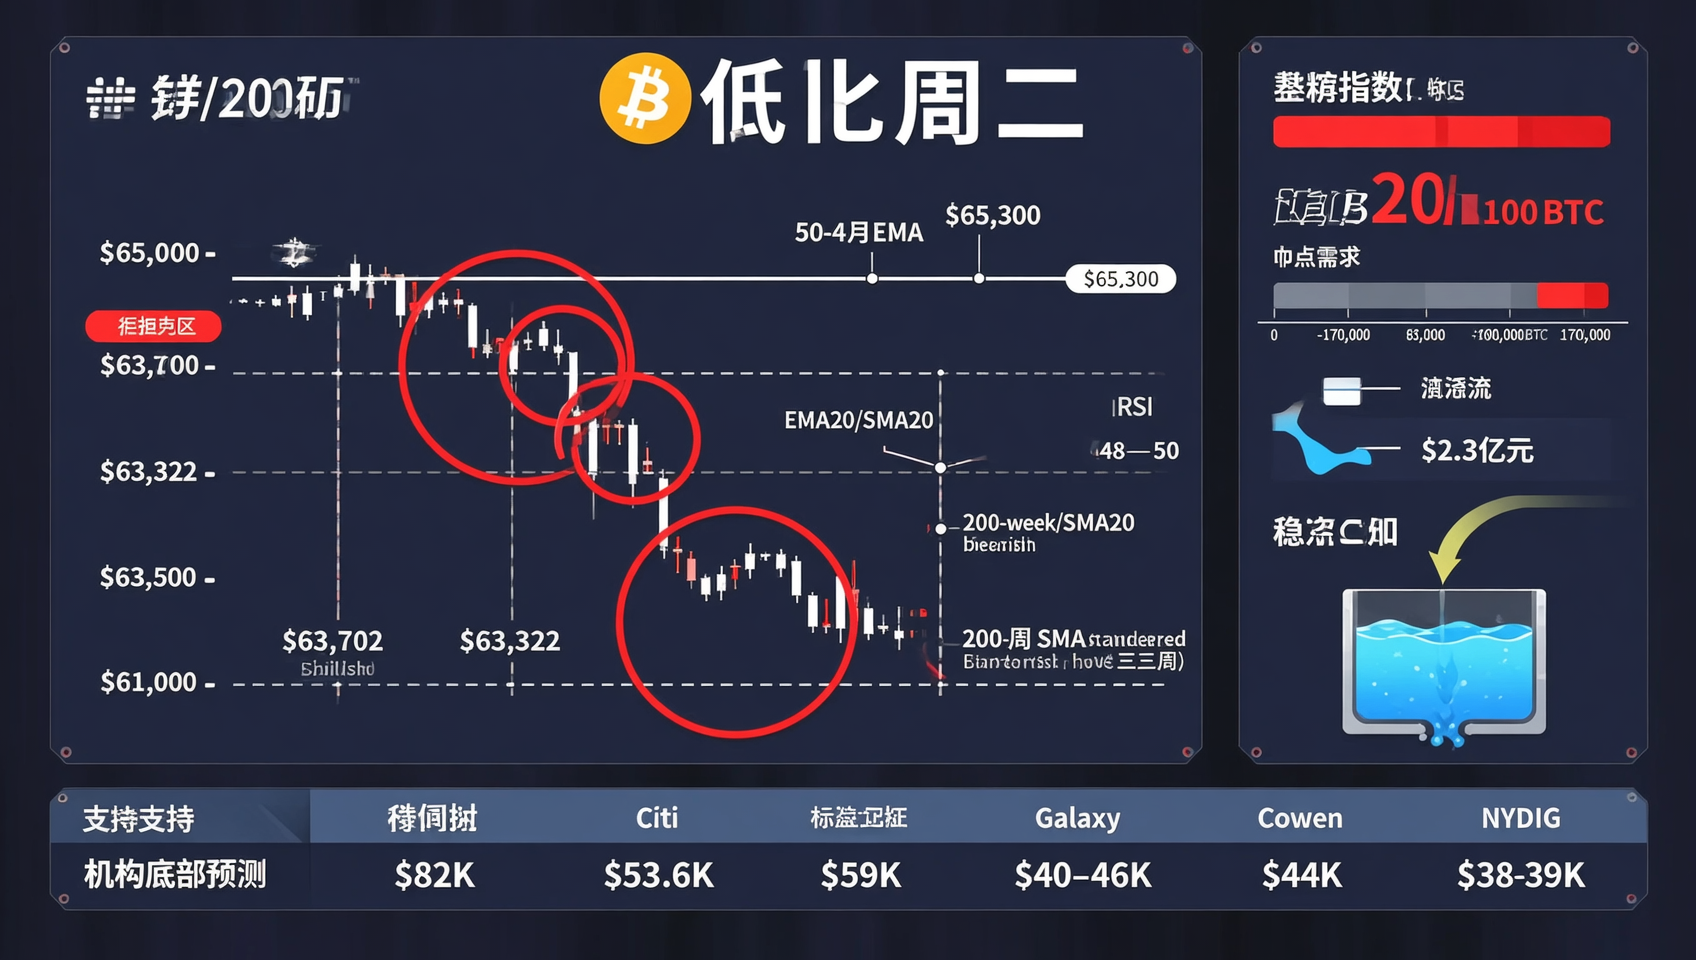
BTC trades at $64,500-$64,800 after three failed attempts at $65K this week. CryptoQuant data reveals 30-day spot demand deteriorated to -170,000 BTC — the market is 'structurally fragile' with derivatives driving price rather than spot buying. Stablecoin reserves at Binance and Bybit declined $2.3B in 30 days, severely limiting breakout firepower. Citi slashed its 12-month BTC target from $112K to $82K and reset ETF net inflow assumptions to zero. The Powerloom chain shut down permanently at 6:00 AM UTC — unbridged assets are locked forever. Bitcoin's BVIV volatility index at 34-38% (historically precedes drops). $420M in aggregate long liquidation risk below $63,700. Benjamin Cowen predicts Q4 bottom near $44K — 'months, not weeks' away.
Tuesday Macro Overview
| Metric | Value | 24h Change |
|---|---|---|
| BTC Price | $64,500-$64,800 | 📉 -0.5%~-1.2% (from Mon high $65,067) |
| ETH Price | ~$1,880-$1,900 | ➡️ Flat |
| SOL Price | ~$76-$77 | ➡️ Flat |
| Total Market Cap | ~$2.19T | 📉 Slight decline |
| BTC Dominance | ~56% | ➡️ Stable |
| Fear & Greed Index | 29 (Fear) | ➡️ Unchanged |
| 30-day Spot Demand | -170,000 BTC | 🔴 Structurally deteriorating |
| 30-day Stablecoin Outflows | -$2.3B | 🔴 Liquidity contraction |
| 24h Liquidations | ~$150M | ➡️ Relatively calm |
| Brent Crude | ~$88-$90 | ➡️ Pulled back from high |
| Gold | >$4,000 | 🟢 Strengthening |
| 10-year Treasury | 4.59% | 📈 Rising |
I. BTC Technical Analysis — Triple Rejection at $65K
Price Action
BTC consolidated in a narrow $64,500-$65,000 range on Tuesday, digesting three failed attempts at the $65K barrier:
| Attempt | Time | High | Result |
|---|---|---|---|
| 1st | Mon Asia | $65,067 | Fast rejection, fell to $64,800 |
| 2nd | Mon late | $64,980 | Denied below $65K |
| 3rd | Tue early | $64,920 | Failed again |
| Current | Tue session | $64,500-$64,800 | Weak consolidation |
Three failed tests is a technically bearish pattern. Each rejection reinforces the $65K-$65,300 resistance zone while exhausting buying momentum.
On-Chain Structural Analysis
| Indicator | Current | Healthy | Status |
|---|---|---|---|
| 30-day Spot Demand | -170K BTC | >0 | 🔴 Severe — derivatives driving price |
| Bull Score Index | 20/100 | >60 | 🔴 Far from sustainable rally |
| 30-day Stablecoin Reserves | -$2.3B | Stable/up | 🔴 Buying power declining |
| Coinbase Premium | Negative since May | >0 | 🔴 Weak US institutional demand |
| BTC Exchange Supply | Lowest since 2017 | — | 🟢 Potential supply squeeze |
| Long-term Holder % | 79% | — | 🟢 HODLers firm |
| Puell Multiple | ATH at cycle bottom | — | 🟢 Miners not capitulating |
Core divergence: Supply side resilience (miners not selling, LTHs at 79%) meets demand side collapse (-170K BTC, -$2.3B stablecoin outflow, negative Coinbase Premium). This divergence is historically resolved either by demand returning (price squeeze up) or further price declines (supply capitulation).
CryptoQuant's recommendation: Cut market exposure from 100% to 30%. The move from $57,950 to $65,067 is a "bear-market recovery, not a trend reversal." 1
Key Levels & Scenarios
| Level | Price | Significance |
|---|---|---|
| Resistance 2 | $65,800-$66,000 | Round number + prior congestion |
| Resistance 1 | $65,000-$65,300 | Psychological + 50-month EMA |
| ➡️ Current | $64,500-$64,800 | Awaiting catalyst |
| Support 1 | $63,702 | EMA 20 / SMA 20 confluence |
| Support 2 | $63,322 | 200-week SMA (held 3 weeks) |
| Support 3 | $61,000-$62,800 | Bull market support zone |
| 📉 Breakdown | ~$59K-$61K | ~25% probability |
| Cowen Q4 bottom | ~$44K | 2018 bear cycle comparison |
II. 📊 Citi Target Cut — Institutional Sentiment Barometer
Full Institutional Bottom Forecast Table
| Institution/Analyst | Bottom Call | Timeframe | Basis |
|---|---|---|---|
| Citi (bull) | $82K | 12 months | Reduced expectations |
| Citi (bear) | $53K | Recession scenario | Continued ETF outflows |
| CryptoQuant | $53.6K (realized price) | 2026 | On-chain valuation model |
| Standard Chartered | $59K | 2026 | Macro conditions improve |
| Galaxy Research | $40K-$46K | 2026 | Historical cycle drawdown |
| Benjamin Cowen | ~$44K | Q4 2026 | 4-year cycle + on-chain |
| NYDIG (extreme) | $38K-$39K | Oct 2026 | Historical floor framework |
What this tells us:
- The widest forecast range ($38K-$82K) reflects extraordinary uncertainty, not consensus
- No major institution expects a new all-time high in 2026
- The average bottom forecast clusters around $45K-$59K
- All forecasts depend on macro conditions (FOMC, CLARITY Act, geopolitics) which remain unresolved 2
III. 💧 Stablecoin Liquidity Crisis — What $2.3B Outflow Means
Flow Breakdown
| Exchange | 30d Stablecoin Net Outflow | % Total |
|---|---|---|
| Binance | -$1.55B | 67% |
| Bybit | -$786M | 33% |
| Total | -$2.3B | 100% |
Contagion Dynamic
- Regulatory pressure → Binance MiCA license gap → $1.8B USDC exits Binance in Q2
- Capital leaving crypto → USDC supply contracts 5.5% ($4.3B net redemptions)
- Exchange reserves depleted → -$2.3B in 30 days → insufficient buying power
- BTC can't break $65K → Derivatives drive the move, spot participation minimal
- CryptoQuant validation → "Bear-market recovery, not trend reversal"
Until stablecoin inflows reverse, BTC lacks the liquidity fuel needed for a sustained breakout above $65K-$65,300. 3
IV. 🥇 BTC vs Gold — The Digital Gold Thesis Falsified
30-Day Rolling Correlation
| Period | BTC-Nasdaq r | BTC-Gold r |
|---|---|---|
| Last 30 days | 0.80 | Near zero |
| US-Iran crisis | 0.78 | 0.05 |
| Tech sell-off | 0.85 | -0.02 |
BTC Price Drivers (July 2026)
| Driver | Impact on BTC | Evidence |
|---|---|---|
| Geopolitical shock | Minimal, neutral | Tight range, no panic |
| Liquidity shock (tech rout) | 📉 Bearish | Fell with Nasdaq, -550 pts |
| Inflation expectations | Bearish | Oil $90+ → CPI → hawkish FOMC |
| Risk appetite | Core driver | Tracking SPX/Nasdaq |
"Bitcoin is being priced as a high-beta liquidity asset, not a safe haven. CPI moves it — missiles do not move M2." 4
V. ⚠️ BVIV Warning & Liquidation Risk
Bitcoin Volatility Index (BVIV)
The 30-day implied volatility index at 34-38% has preceded multiple corrections:
| Prior Episode | BVIV Level | Outcome |
|---|---|---|
| Late May 2026 | 34-38% | BTC fell from $74K to below $60K in under a week |
| February 2026 | 34-38% | Sharp correction followed |
| October 2025 ATH | Below range | Volatility compression preceded upside |
BVIV currently sits below both its 30-day and 200-day moving averages — volatility is "cheap" and prone to mean-revert higher. 5
Liquidation Risk Monitor
| Trigger Price | Cumulative Long Size | Risk Level |
|---|---|---|
| $63,700 | $420M | First liquidation cluster |
| $63,322 (200-week SMA) | Escalating | Critical level (held 3 weeks) |
| $61,000 | Chain reaction risk | Bull/bear line |
BTC at $64,500-$64,800 sits just $800-$1,100 above the first liquidation trigger. A break of $63,700 could trigger cascading liquidations.
VI. 🔮 Scenario Analysis & Key Catalysts
| Scenario | Probability | BTC Range | Trigger |
|---|---|---|---|
| 📈 Break above $65K | ~15% | $65.3K-$67K | Dovish FOMC + stablecoin inflow reversal |
| ➡️ $64K-$65K consolidation | ~60% | $64.5K±$1K | Waiting on FOMC, CLARITY unresolved |
| 📉 Break below $63K | ~25% | $59K-$62K | Hawkish FOMC + CLARITY blocked |
Next Week's Key Events
| Date | Event | Impact |
|---|---|---|
| This week | US-Iran / Oil ($80-$90) | ⭐⭐⭐⭐ |
| This week | Big Tech earnings (Tesla, Alphabet) | ⭐⭐⭐ |
| Jul 28-29 | 🔥🔥🔥 FOMC decision | ⭐⭐⭐⭐⭐ |
| Jul 31 | BTC monthly close | ⭐⭐⭐⭐ |
| Aug 7 | Congress recess — CLARITY deadline | ⭐⭐⭐⭐⭐ |
⚠️ Disclaimer: This market analysis is for informational purposes only and does not constitute investment advice. The market faces deteriorating spot demand (-170K BTC), $2.3B in stablecoin outflows, the approaching FOMC decision, and the narrowing CLARITY Act window. BTC is blocked at $65K with structurally fragile on-chain conditions. CryptoQuant recommends reducing exposure to 30%. Cryptocurrency markets are extremely volatile — manage risk carefully.
Recommended: Binance Registration | OKX Registration
📚 Further Reading: On-Chain Guide — Blockchain from Zero — Blockchain basics and on-chain data analytics tutorials
📖 Related reads:
Footnotes:
Footnotes
-
Source: CryptoQuant analyst Darkfost, The Block "CryptoQuant says bitcoin rebound remains a bear-market recovery," July 2026 ↩
-
Source: Citi research by Alex Saunders, reported by Coinspeaker and Moneycontrol, July 2026; Benjamin Cowen Bitcoin Cycle Memo, July 16, 2026; Galaxy Research; NYDIG; Standard Chartered ↩
-
Source: CryptoQuant QuickTake "Binance and Bybit see Over $2.3B in stablecoin outflows," July 20, 2026; The Block Beats ↩
-
Source: crypto.news "Bitcoin stopped trading the war," July 2026; Ainvest.com "Bitcoin Is Not Digital Gold. The Data Confirms It." ↩
-
Source: Edgen.tech "Bitcoin holds near $64,000 as 3 bearish on-chain signals flash," July 20, 2026; TokenPost volatility reporting ↩