
July 22 Market Analysis: BTC Breaks $65K - Resistance Becomes Support, $66K Consolidation, ETF $727M Inflow, CLARITY Catalyst, FOMC Preview
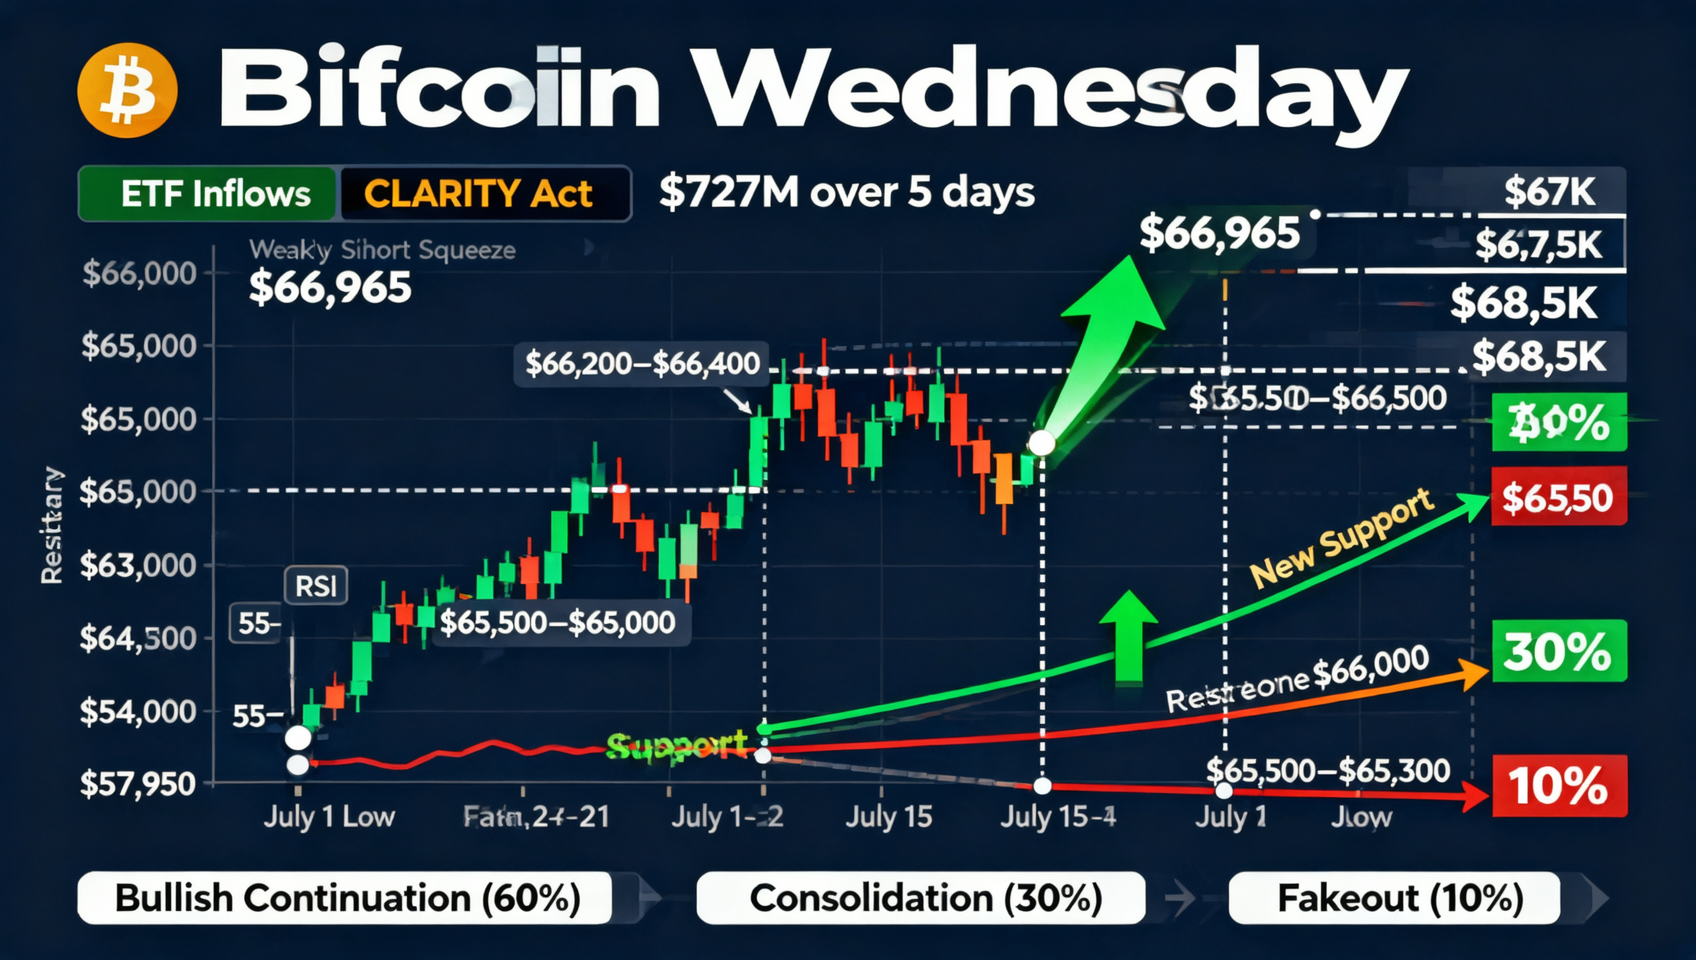
BTC decisively broke through the $65K resistance zone on Wednesday, reaching $66,965 before consolidating at $66,200-$66,400 - up 2.5% in 24 hours. US spot Bitcoin ETFs posted $727M in net inflows over 5 consecutive sessions (longest streak since early May), with BlackRock transferring 1,789.65 BTC ($119M) to IBIT. The CLARITY Act achieved a major breakthrough as the White House accepted ethics provisions. $463.9M in leveraged positions were liquidated (63% shorts) triggering a short squeeze. Ethereum tested $1,950 for the first time in 7 weeks. BTC dominance rose to ~59%. Polymarket prices 93% odds of a rate hold at the July 28-29 FOMC meeting. Key levels: resistance $67K-$68K, support $65.5K-$66K with $65K-$65.3K transitioning from resistance to support.
Wednesday Macro Overview
| Metric | Value | 24h Change |
|---|---|---|
| BTC Price | $66,200-$66,400 | 📈 +2.5% (high $66,965) |
| ETH Price | ~$1,919-$1,924 | 📈 +1.5%~2% (high $1,954) |
| SOL Price | ~$78-$80 | 📈 +2%~3% |
| XRP Price | ~$1.14 | 📈 +2.5%+ |
| Total Market Cap | ~$2.25T | 📈 Significant recovery |
| BTC Dominance | ~59% | 📈 Rising |
| Fear and Greed Index | 33 (Fear) | 🟢 Recovered from 25 |
| ETF 5-day Cumulative | +$727M | 🟢 Longest streak since early May |
| 24h Liquidations | ~$463.9M | 🔥 63% shorts |
| Brent Crude | ~$84.70 | 📈 +2.6% |
| Gold | >$4,000 | 🟢 Holding above $4K |
| 10-year Treasury | 4.63% | ➡️ Slightly elevated |
I. BTC Technical Analysis - Decisive $65K Breakout
Formation
| Phase | Period | Range | Characteristic |
|---|---|---|---|
| Bottom and Rebound | Jul 1-15 | $57,950 to $65,000+ | +15.5% from July low |
| Resistance Accumulation | Jul 15-21 | $64,500-$65,067 | Three failed $65K tests |
| Breakout | Jul 22 (today) | $65,000 to $66,965 | High-volume, ETF buying |
| Consolidation | Current | $66,200-$66,400 | Post-breakout |
Breakout Confirmation Checklist
| Condition | Status |
|---|---|
| ✅ Price above resistance | Confirmed ($66,200+ >> $65,000) |
| ✅ Volume elevated | Confirmed |
| ✅ RSI not overbought | ~55-58 (healthy) Room to run |
| ⏳ Retest holds new support | Pending - awaiting coming days |
| ✅ Short-term MA bullish | Confirmed (EMA20 > SMA20) |
Key Levels
$68,000-$68,500 - Strong resistance $67,500 - Psychological resistance $67,000 - Today's rejection high
$66,200-$66,400 - Current consolidation $65,500-$66,000 - Retest support zone $65,000-$65,300 - Old resistance becomes new support ------------------------------------- Breakout confirmation line $64,000-$64,500 - Middle zone (breakdown warning) $63,702 - EMA20/SMA20 $63,322 - 200-week SMA
Post-Breakout Scenarios
| Scenario | Prob. | BTC Range | Trigger |
|---|---|---|---|
| 📈 Extend to $68K+ | ~30% | $67K-$68.5K | ETF inflows + CLARITY vote |
| ➡️ $65.5K-$67K consolidation | ~50% | $66K+-$1K | Awaiting FOMC |
| 📉 Fakeout to $64K-$65K | ~20% | $63.5K-$65K | Hawkish FOMC + CLARITY blocked |
II. 📊 ETF Flow Analysis
| Day | Net Inflow | Cumulative |
|---|---|---|
| Day 1 | ~$120M | $120M |
| Day 2 | ~$150M | $270M |
| Day 3 | ~$100M | $370M |
| Day 4 | ~$80M | $450M |
| Day 5 | $227M | $727M |
Going from June's $4.5B exodus to this week's $727M sustained inflow represents a structural shift in institutional behavior. 1
III. 🏛️ CLARITY Act - Regulatory Catalyst
| Stage | Status |
|---|---|
| House passage | ✅ Complete |
| White House ethics | ✅ Accepted (Jul 22) |
| Senate vote | 🔄 Earliest next week |
| Recess deadline | Aug 7 |
CLARITY would remove the single biggest barrier to mainstream institutional adoption: regulatory uncertainty. 2
IV. 💰 Liquidation Structure
| Dimension | Jul 22 (Today) | Jul 21 |
|---|---|---|
| Total | $463.9M | ~$150M |
| Shorts | 63% ($292M) | Mostly longs |
| Longs | 37% ($172M) | Mostly |
| Direction | Short squeeze | Longs liquidated |
| Largest | $125.3M | ~$10M |
Short squeeze served as accelerant: $292M in shorts cleared reduces selling pressure, new longs established at $66K create demand support. 3
V. ETH Technical Analysis
| Metric | Data |
|---|---|
| Current | ~$1,919-$1,924 |
| 7-Week High | $1,954 |
| ETH/BTC | ~0.029 |
Key levels: Resistance $2,000-$2,100, Support $1,880-$1,915. ETH needs BTC stability above $66K and capital rotation for full breakout.
VI. FOMC Preview (Jul 28-29)
| Decision | Probability | Impact |
|---|---|---|
| Hold rates | 93% | 🟢 Expected |
| Rate cut | <5% | 🟢🟢 Extremely bullish |
| Rate hike | <2% | 🔴🔴 Black swan |
VII. Key Events
| Date | Event | Impact |
|---|---|---|
| This week/next | CLARITY Act Senate vote | ⭐⭐⭐⭐⭐ |
| Jul 28-29 | FOMC rate decision | ⭐⭐⭐⭐⭐ |
| Jul 31 | BTC monthly close | ⭐⭐⭐⭐ |
| Aug 7 | Congress recess deadline | ⭐⭐⭐⭐⭐ |
Disclaimer: This market analysis is for informational purposes only and does not constitute investment advice. BTC has just broken $65K resistance - confirmation requires holding $65K-$65.5K on retests. Cryptocurrency markets are extremely volatile - manage risk carefully.
Recommended: Binance Registration | OKX Registration
📚 Further Reading: On-Chain Guide - Blockchain from Zero
📖 Related reads:
Footnotes: