
July 24 Market Analysis: BTC Pulls Back to $65K — Oil Above $100 Triggers Risk-Off, CLARITY Delayed, FOMC Hike Odds at 40%, ETF $818M Inflow
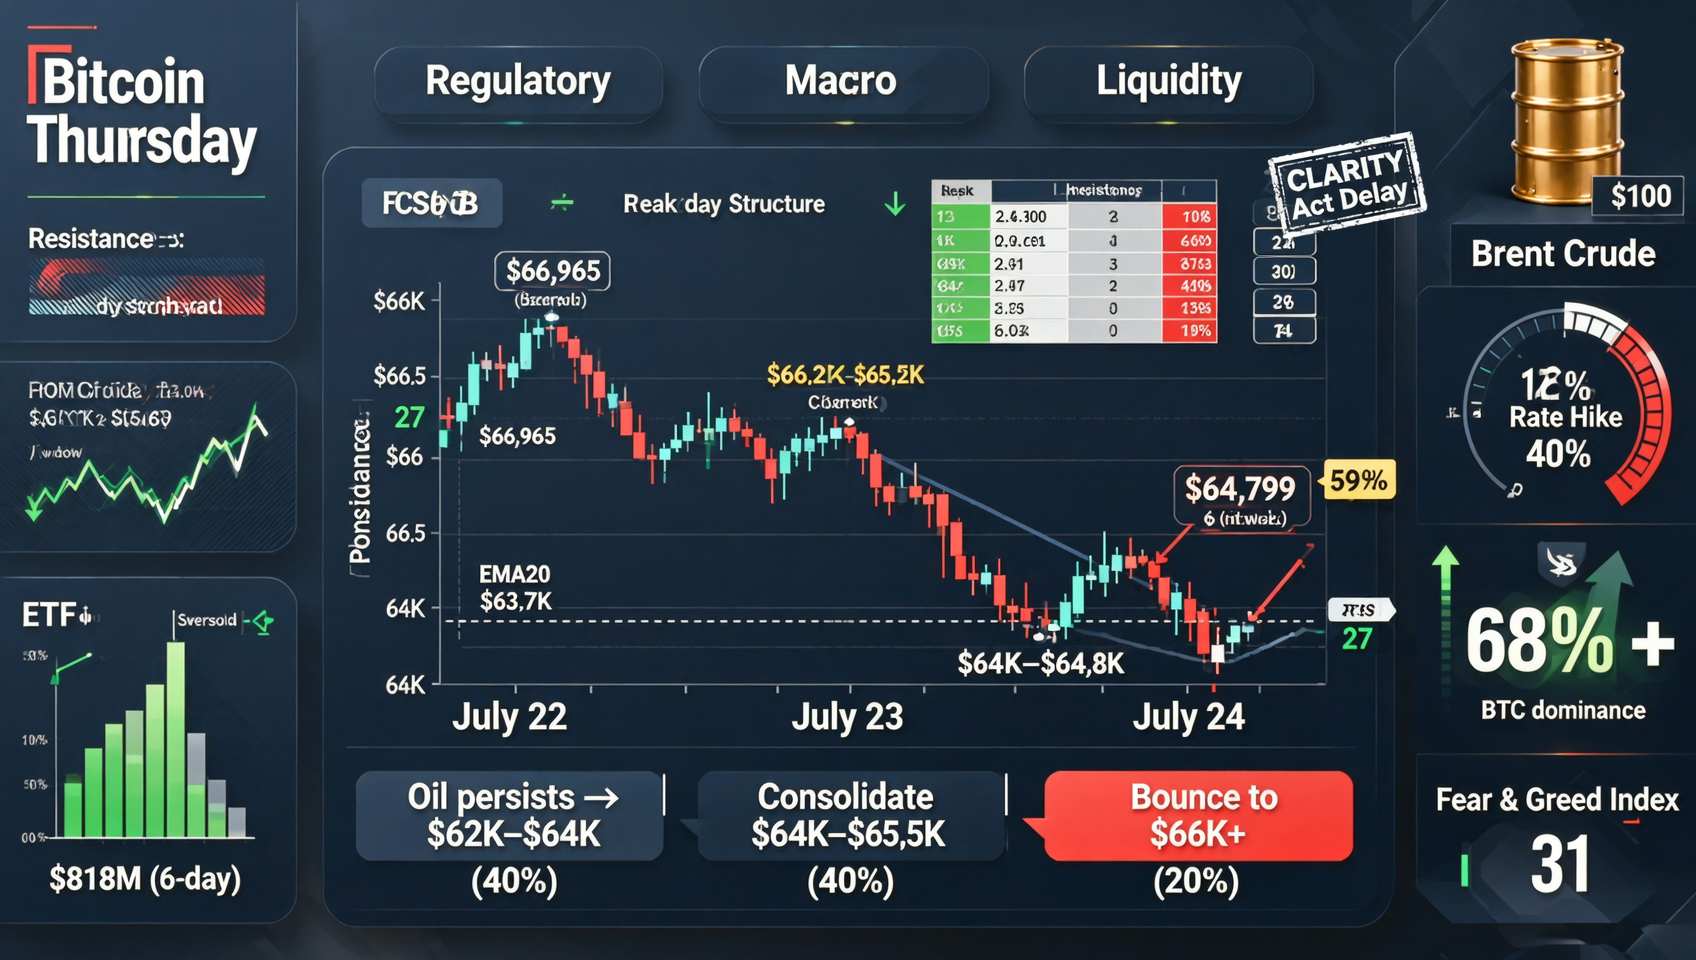
BTC pulled back from $66K+ to the $65K area on Thursday, hitting a three-day low of $64,799, down 1.5%-2% in 24 hours. Three headwinds dominate: (1) Brent crude above $100/barrel for the first time since August 2025, triggering global risk-asset selloff; (2) CLARITY Act Senate vote did not occur on July 23 — seven Democrats rejected the draft; (3) FOMC rate hike odds surged from 12% to 40% on oil-driven inflation fears. BTC spot ETFs provided a floor with six consecutive days of $818M inflows. BTC dominance jumped to 68%+, RSI hit 27 nearing oversold, and Fear and Greed fell to 31. ETH dropped to ~$1,890 (-2.8%), SOL ~$76 (-2.5%), XRP ~$1.10 (-2.8%). Key levels: resistance $66K-$66,965, support $64K-$64,800, EMA20 at $63,702.
Thursday Macro Overview
| Metric | Value | 24h Change |
|---|---|---|
| BTC Price | ~$64,800-$65,200 | 📉 -1.5% to -2% (low $64,799) |
| ETH Price | ~$1,885-$1,895 | 📉 -2.8% |
| SOL Price | ~$76-$77 | 📉 -2.5% |
| XRP Price | ~$1.09-$1.11 | 📉 -2.8% (CLARITY delay) |
| Total Market Cap | ~$2.15T | 📉 -~$90B from yesterday |
| BTC Dominance | 68%+ | 📈 Massive jump — capital fleeing altcoins for BTC |
| Fear and Greed | 31 (Fear) | 🔴 Down from 33 |
| RSI (14) | ~27 | 🔴 Approaching oversold — historical bounce level |
| ETF 6-Day Cumulative | +$818M | 🟢 Continuous support |
| 24h Liquidations | ~$120M+ | Normal |
| Brent Crude | >$100/barrel | 🚨 First time since Aug 2025 |
| S&P 500 | -1.2% | 🚨 Risk-off |
| Nasdaq | -2.2% | 🚨 Tech hardest hit |
| 10-year Treasury | >4.70% | 📈 Rising on inflation fears |
I. BTC Technical Analysis — The $65K Defense
Pullback Structure
| Phase | Period | Range | Characteristic |
|---|---|---|---|
| Breakout | Jul 22 | $65,000 to $66,965 | High-volume, ETF-driven |
| Consolidation | Jul 23 | $66,000-$66,500 | Awaiting CLARITY vote |
| Pullback | Jul 24 (today) | $66,000 to $64,799 | Triple headwind — oil, CLARITY, FOMC |
Key Levels
$68,000-$68,500 ──── 🔴 Strong resistance (since April) $67,500 ──── 🔴 Psychological $66,200-$66,965 ──── 🔴 Yesterday's breakout zone — now new resistance
$65,200-$65,500 ──── 🟡 Upper resistance zone $65,000 ──── ➡️ Psychological — $65K defense $64,800-$65,000 ──── ➡️ Current range
$64,000-$64,800 ──── 🟢 Support (includes today's low $64,799) $63,702 ──── 🟡 EMA20 — below = short-term trend weakens $63,322 ──── 🟢 200-week SMA — last defense
Technical Indicators
| Indicator | Current | Signal |
|---|---|---|
| RSI (14) | ~27 | 🔵 Oversold bounce signal |
| MACD | Bearish cross | 🔴 Short-term negative |
| Volume | Above yesterday | ⚠️ Selling pressure real |
| BTC Dominance | 68%+ | ➡️ Flight-to-safety mode |
RSI 27 Historical Context
When BTC RSI hit 27-30 in the past 18 months: recent Jul low (~28) → +10% bounce; May 2026 (~26) → +8%; Dec 2025 (~25) → +12%; Aug 2025 crash (~20) → +15%. RSI at 27 signals technical oversold — historically a setup for short-term recovery, but the direction depends on macro catalysts. 1
II. 🛢️ Oil Above $100 — A Macro Game Changer
Impact Dimensions
| Dimension | Detail |
|---|---|
| Inflation path | $100+ oil → July CPI may reaccelerate → rate cut hopes challenged |
| FOMC policy | Hike odds 12%→40% in one week |
| Risk appetite | S&P 500 -1.2%, Nasdaq -2.2% |
| Dollar strength | USD up → BTC inversely pressured |
| Gold | >$4,000 — safe-haven capital flows to gold, not BTC |
Historical estimate: every $10 oil increase translates to approximately -3% to -5% short-term impact on BTC. 1
III. 🏛️ CLARITY Act — Timing Uncertainty
Window Narrowing
| Date | Status |
|---|---|
| Jul 22 | White House accepts ethics — optimism peak |
| Jul 23 | ❌ No vote — 7 Dems reject |
| Jul 24 (today) | Thune pushes but obstacles remain |
| Jul 28-29 | FOMC — CLARITY may be crowded out |
| Aug 7 | Congress recess — delay to Sep |
'Pending' is worse than a clear rejection for markets — it prevents capital from making long-term allocation decisions based on regulatory clarity. 2
IV. 📊 ETF $818M Inflow — Institutional Support vs Macro Pressure
| Stat | Data |
|---|---|
| Consecutive days | 6 |
| Cumulative | $818M |
| Since launch | $51.8B |
Today's price action represents a tug-of-war between institutional buying (ETF inflows) and macro selling pressure (oil + CLARITY + FOMC). Currently macro is winning — but institutions buying during the dip is a positive signal for the medium term. 3
V. 💎 ETH Technical Analysis
| Metric | Data |
|---|---|
| Current | ~$1,885-$1,895 |
| 24h | 📉 -2.8% |
| ETH/BTC | ~0.029 — weakening |
| RSI | ~25 — also nearing oversold |
Levels: Resistance $1,920-$1,950, Current ~$1,885-$1,895, Support $1,850-$1,880, Strong support $1,800-$1,830. ETH declines more than BTC (-2.8% vs -1.5-2%), confirming the capital rotation to BTC. 4
VI. 📈 BTC Dominance 68%+ — Deep Dive
BTC dominance surging from ~59% to 68%+ in a single day is exceptional:
- BTC relatively holds (-2% vs altcoins -2.5-3%+)
- No ETF support for altcoins — no institutional buying to cushion falls
- XRP hit hardest by CLARITY delay (bill would reclassify XRP as commodity)
- Flight to safety within crypto ecosystem
Historically, extreme BTC dominance readings often precede reversal points — but timing is uncertain. 5
VII. 🔄 FOMC Preview — From Certain to Uncertain
| Probability | Jul 16 | Jul 24 |
|---|---|---|
| Hold rates | 93% | 60% |
| Hike 25bp | 12% | 40% |
| Cut | <5% | <2% |
If oil stays above $100 until the Jul 28-29 FOMC meeting, the rate hike probability may rise further. Key signals to watch: oil price trajectory before Jul 28, FOMC statement wording on oil/inflation, and Powell's press conference characterization of the oil shock. 6
VIII. Key Events
| Date | Event | Impact |
|---|---|---|
| Jul 24-27 | Geopolitical developments | ⭐⭐⭐⭐ Oil stays above $100 |
| Jul 28-29 | 🔥🔥🔥 FOMC rate decision | ⭐⭐⭐⭐⭐ Hike odds 40% |
| This week/soon | 🔥🔥🔥 CLARITY Act vote | ⭐⭐⭐⭐⭐ Delayed |
| Jul 31 | BTC monthly close | ⭐⭐⭐⭐ Likely red month |
| Aug 7 | Congress recess deadline | ⭐⭐⭐⭐⭐ CLARITY last chance |
Disclaimer: This market analysis is for informational purposes only and does not constitute investment advice. BTC faces triple headwinds: oil above $100, CLARITY Act delay, and FOMC rate hike fears (40% probability). RSI at 27 approaches oversold — potential for short-term bounce but macro direction dominates. ETF $818M/6-day inflow provides support. FOMC July 28-29 is the critical risk event. Cryptocurrency markets are extremely volatile — manage risk carefully.
Recommended: Binance Registration | OKX Registration
📚 Further Reading: On-Chain Guide - Blockchain from Zero
📖 Related reads:
Footnotes:
Footnotes
-
Source: TradingView BTC/USD; CoinMarketCap; Cointelegraph "Bitcoin and Risk Assets Feel the Strain as Iran War Spikes US Bond Yields," July 24, 2026 ↩ ↩2
-
Source: Cryptopolitan "Seven pro-crypto Democrats reject CLARITY"; Crypto.news, July 23-24, 2026 ↩
-
Source: CryptoTimes "Bitcoin Holds $65K as Spot ETF Inflows Reach $818M"; SoSo Value, July 24, 2026 ↩
-
Source: TradingView ETH/USD; CoinMarketCap, July 24, 2026 ↩
-
Source: MytokenCap "BTC dominance rises above 68%," July 24, 2026 ↩
-
Source: Polymarket FOMC odds, July 24, 2026 ↩