
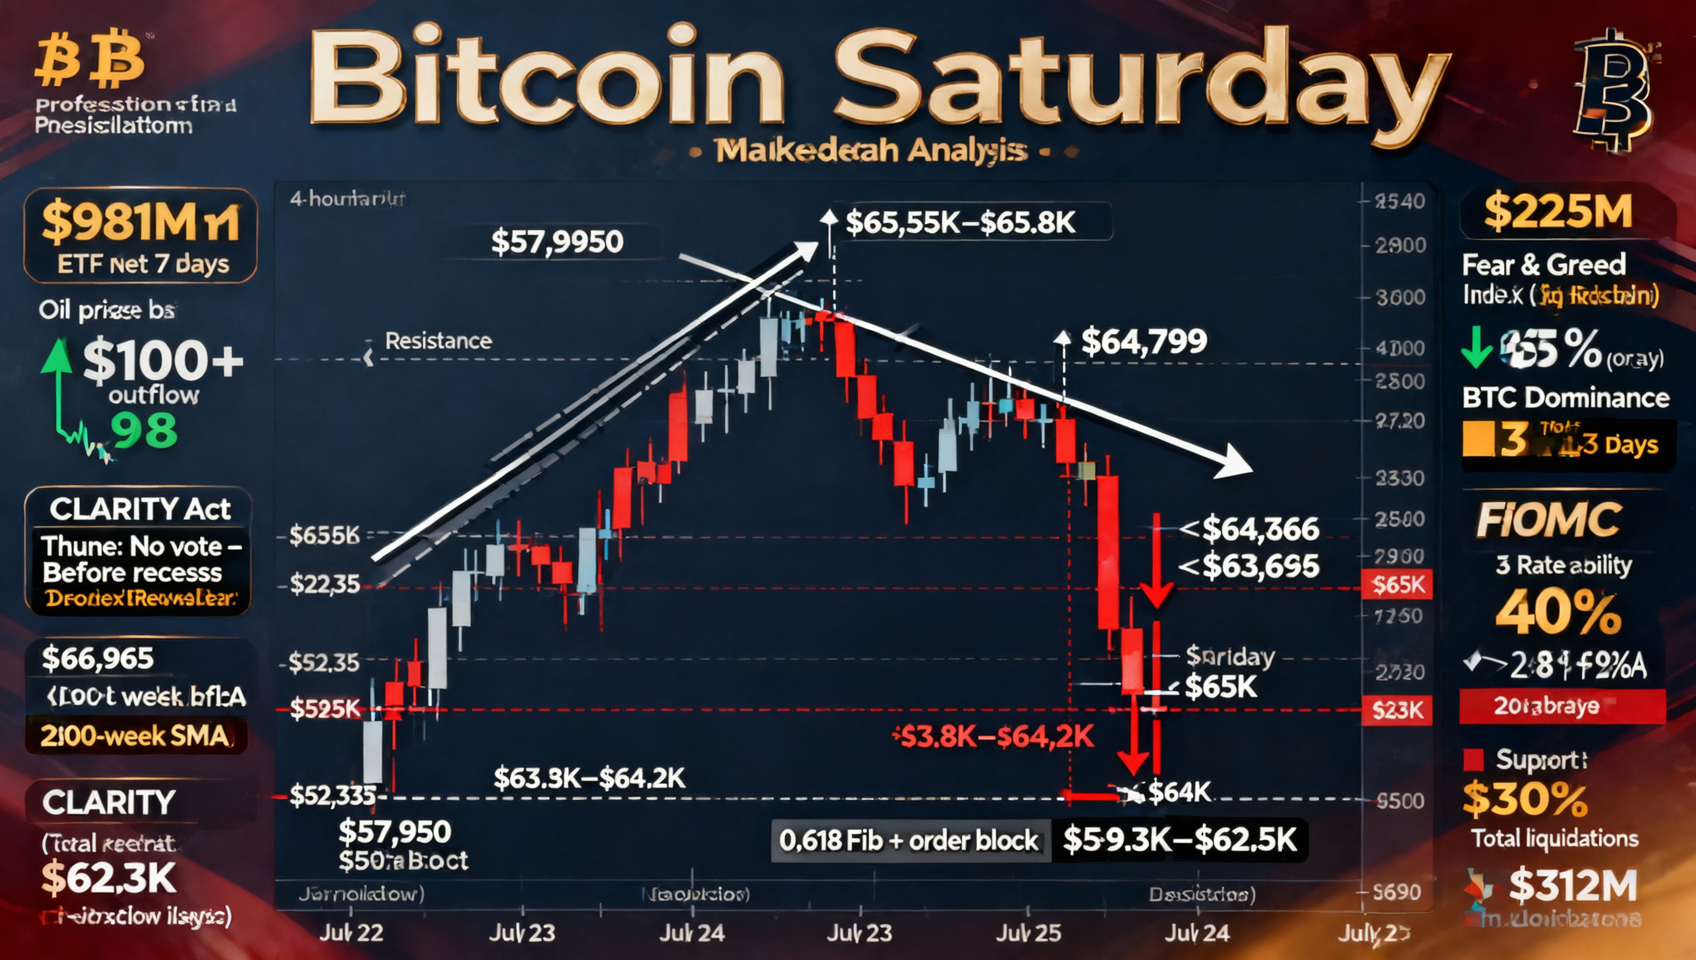
July 25 Market Analysis: BTC Breaks Below $64K — ETF 7-Day $981M Inflow Streak Ends With $225M Outflow, CLARITY Recess Hopes Dashed, Oil Retreats Below $100, FOMC Hike Odds Drop to 30%, BTC Conference Curse
BTC broke below $64K on Friday after spiking to $65,705, hitting an intraday low of $63,666 — down 1.5% in 24h, erasing nearly all gains since July 22. The 7-day ETF inflow streak (+$981M) ended with $225.2M in net outflows ($202.5M from BlackRock IBIT), signaling institutional capital withdrawal. Senate Majority Leader Thune publicly stated the CLARITY Act is unlikely to pass before the August recess, Polymarket odds falling to 33%. Oil retreated from $100+ to ~$98/barrel, easing macro pressure. FOMC rate hike odds dropped from 40% to ~30%. Fear and Greed fell to 28 (Fear), BTC dominance ~65%+. 24h liquidations reached $312M. 4H chart shows a descending channel, key support $62,335 (0.618 Fib + order block), strong support $59K-$62.5K (200-week MA zone). BTC conference historical sell-the-event pattern struck again.
July 25 Macro Data Overview
| Metric | Value | 24h Change |
|---|---|---|
| BTC Price | ~$63,800-$64,200 | 📉 -1.5% (low $63,666, high $65,705) |
| ETH Price | ~$1,854-$1,925 | 📉 -1.5% to -2% (following BTC down) |
| SOL Price | ~$73-$77 | 📉 -1.5% to -2.5% (ATH $294 -> 74% decline) |
| XRP Price | ~$1.08-$1.13 | 📉 -0.26% (7-day, CLARITY delay headwind) |
| Total Market Cap | ~$2.19T | 📉 Down ~$60B from yesterday |
| BTC Dominance | ~65% | ➡️ Pulled back from 68%+ but still elevated |
| Fear and Greed | 28 (Fear) | 🔴 Approaching Extreme Fear — near recent lows |
| RSI (14) | ~38 | 🟡 Slight recovery from yesterday's 27 (oversold) but still in weak territory |
| ETF Latest Day (Jul 24) | -$225.2M | 🚨 7-day inflow streak ends — reversal signal |
| 24h Liquidations | ~$312M | 🔴 2x normal — longs $242M (78%) |
| Brent Crude | ~$97-$98/barrel | 🟢 Retreat from $100+ — macro pressure partially eased |
| 10-Year Treasury Yield | ~4.31% | ➡️ Slightly down from yesterday's high |
| 30-Year Treasury Yield | 5.25% | ⚠️ Critical level — still elevated |
I. BTC Technical Analysis — Key Levels After Breaking $64K
Full Price Action Timeline
| Phase | Time | Price Range | Characteristic |
|---|---|---|---|
| Bottom and Rebound | Jul 1-15 | $57,950 -> $65,000+ | +15.5% from July low — double bottom formation |
| Resistance Accumulation | Jul 15-21 | $64,500-$65,067 | Three failed $65K tests — accumulation phase |
| Breakout Surge | Jul 22 | $65,000 -> $66,965 | High-volume breakout — ETF buying + CLARITY expectations |
| High Consolidation | Jul 23 | $66,000-$66,500 | Narrow range — awaiting CLARITY vote |
| Triple Headwind Pullback | Jul 24 | $66,965 -> $64,799 | Oil $100+ + CLARITY delay + FOMC hike odds 40% |
| Spike and Breakdown Below $64K | Jul 25 (Today) | $65,705 -> $63,666 -> $64,200 | Spike lure -> sharp plunge -> break below $64K |
Key Price Structure
Price structure (top to bottom):
🔴 $66,200-$66,965 — Jul 22 breakout zone, now left behind 🔴 $65,800-$66,000 — Institutional ETF buy cost upper edge, broken 🔴 $65,500-$65,800 — Key resistance, today's spike to $65,705 tagged it 🔴 $65,000-$65,300 — Old support → New resistance, $65K psychological level 🔴 $64,800-$65,000 — Short-term resistance
➡️ Current range: $64,000-$64,200 — $64K battle zone
🟢 $63,500-$63,800 — Buffer support, $63,666 today's low 🟢 $63,000-$63,500 — 4H support zone, medium-term defense line 🟡 $62,335 — Key support, 0.618 Fibonacci + 4H order block 🟡 $61,400-$62,000 — Deepening retracement zone
🟢 $59,356-$62,492 — 200-week MA region, bull-bear boundary 🔵 $48,000-$57,000 — Extreme case, deep adjustment zone
Technical Indicator Status
| Indicator | Current Value | Interpretation | Signal |
|---|---|---|---|
| RSI (14) | ~38 | Slight recovery from 27 (oversold) — weak zone | ➡️ Neutral-bearish |
| MACD | Fast line below zero | Momentum turns negative — bears accelerating | 🔴 Bearish |
| 4H MA System | Price below EMA20/50 | Short-term MAs forming resistance | 🔴 Bearish alignment |
| Volume | Elevated vs yesterday | Selling on volume — real selling pressure | ⚠️ Watch |
| 4H Candle Structure | Descending channel | Stepped decline from $65,808 high | 🔴 Bearish |
| BTC Dominance | ~65%+ | Pulled back from 68%+ — capital not yet flowing to alts | ➡️ Risk-off |
RSI 38 Interpretation — Difference from Yesterday's RSI 27
| Time | RSI | Meaning |
|---|---|---|
| Jul 24 | 27 🔴 Oversold | Extremely oversold — short-term bounce probability high |
| Jul 25 | 38 🟡 Weak | Recovered from oversold — but not back to neutral — bounce limited |
The RSI recovery from 27 to 38 indicates: yesterday's oversold condition did trigger some technical buying (today's Asian session spike to $65,705 was that recovery), but $65,705 was unsustainable — stronger selling pressure at the $65K+ range led to the second decline and break below $64K. The current 38 reading in the weak zone suggests the market lacks sustained rebound momentum. 1
4H Descending Channel
On the 4-hour chart, BTC has formed a clear stepped descending channel since the $65,808 high:
- Channel upper trendline: $65,808 -> $65,705 -> $65,200 (progressively lower)
- Channel lower trendline: $64,799 -> $63,666 (progressively lower)
- Current: In the $63,800-$64,200 range — near the channel's mid-lower section
If BTC:
- Holds $64,000 -> Possible correction toward $64,500-$65,000 (channel upper test)
- Breaks below $63,666 (today's low) -> Next target $62,335 (0.618 Fibonacci)
- Loses $62,000 -> Pullback deepens to $59K-$62K (200-week MA region)
II. ETF 7-Day Inflow Streak Ends — From $981M to $225M Outflow
The Inflow-to-Outflow Turn
| Period | ETF Net Flow | BTC Price Range |
|---|---|---|
| Jul 17-23 (7 days) | +$981M 🟢 | $63,000 -> $66,965 |
| Jul 24 (Thursday) | -$225.2M 🚨 | $66,965 -> $64,799 |
| Jul 25 (Friday, current) | Pending | $63,666-$64,200 |
Outflow Breakdown
| Fund | Outflow | Notes |
|---|---|---|
| BlackRock IBIT | -$202.5M | 90% of total outflow |
| Bitwise BITB | -$7M | Small outflow |
| Fidelity FBTC | -$5.6M | Small outflow |
| ARK 21Shares ARKB | -$4.3M | Small outflow |
| Morgan Stanley MSBT | +$5M | 🟢 Only positive inflow |
| Others | ~$0 | Unchanged |
Why IBIT's $202.5M Outflow Is a Significant Signal
IBIT (BlackRock's Bitcoin ETF) was the largest contributor to the 7-day inflow streak — accounting for 90% of the $225M total outflow. This means the selling is not retail behavior but large institutions choosing to reduce positions.
Possible rationale:
- CLARITY expectations dashed — Institutions built positions based on CLARITY passage expectations; Thune's statement directly triggered position reduction
- Oil shock de-risking — Risk parity strategies reducing all risk exposure under energy shock
- Pre-FOMC defense — Proactively reducing positions before FOMC uncertainty rises
- Profit-taking — The 7-day rally from $65K-$66K provided $981M in buy-side, with $225M outflow representing ~23% — a reasonable profit-taking ratio
The key question is not the $225M outflow itself, but whether it evolves into a trend. If outflows continue next week (>$200M/day), July's rally will be completely reversed. If outflows converge to <$50M next week, the $225M is just normal profit-taking. 2
III. CLARITY Act — From High Likelihood to Probable Delay
The Weight of Thune's Statement
John Thune, as Senate Majority Leader, his statement represents the official position of Republican leadership: "Does not expect the Senate to pass the CLARITY Act before the August recess."
| Previous Expectation | Current Reality |
|---|---|
| Jul 23 vote — passage | Jul 23 no vote — 7 Democrats opposed |
| Passage before end of July | Thune says unlikely before recess |
| ~60% passage odds for 2026 | Polymarket falls to 33% |
Impact Path on BTC
The CLARITY Act moving from high-probability passage to probable delay affects BTC on multiple levels:
- Short-term: Regulatory catalyst disappears — capital that bought on CLARITY expectations withdraws — BTC gives back $66K -> $64K gains
- Medium-term: Next window opens after November election — 6-month regulatory vacuum — market needs new narrative drivers
- Possible outcome: Bill may eventually pass (2026-2027 cross-year window), but shifts from "short-term catalyst" to "medium-term background positive"
BTC's rally from July 1 low of $57,950 to the July 22 high of $66,965 gained +15.5% — CLARITY expectations contributed at least half of those gains. Now that catalyst has disappeared, and the gains are gradually being given back. 3
IV. Oil Retreats from $100+ — Macro Landscape Shift
Oil Price Action
| Time | Brent Crude | Key Event |
|---|---|---|
| Jul 24 Peak | >$100/barrel | US-Iran conflict — 12-hour airstrikes + Trump warning |
| Jul 25 (Today) | ~$97-$98/barrel | Slight pullback — but still in conflict premium zone |
Three-Layer Oil-to-Crypto Transmission
| Transmission Layer | Mechanism | Current Status |
|---|---|---|
| Inflation -> Rates | Oil -> CPI expectations -> FOMC path | 🟢 Eased: rate hike odds drop from 40% to 30% |
| Risk Appetite | Oil -> Growth expectations -> risk-on/off | 🟡 Improving: stock markets stabilizing after oil retreat |
| Dollar | Oil -> Energy imports -> USD strength | 🟢 USD pulling back slightly from highs |
The $2-3 oil retreat may seem minor, but it changes the FOMC's "must hike" logic at the margin — which was exactly the scenario markets feared most on July 24. When Brent crude fell from above $100 back to $98, July rate hike odds also dropped from 40% to around 30%. 4
V. Fear and Greed at 28 — The Market's True Sentiment
Fear and Greed Trend
| Date | Index | Zone |
|---|---|---|
| Jul 1 (low $57,950) | 25 | 🔴 Extreme Fear |
| Jul 15-21 | 28-33 | 🔴 Fear (recovering daily) |
| Jul 22 (broke $65K) | 33 | 🔴 Fear — no FOMO |
| Jul 23 | 33 | 🔴 Fear — flat |
| Jul 24 (pulled back to $65K) | 31 | 🔴 Fear — slight decline |
| Jul 25 (today, broke $64K) | 28 | 🔴 Fear — approaching Extreme Fear |
What 28 Means
The Fear and Greed Index at 28 indicates market sentiment has fallen to its lowest since July 1 ($57,950 bottom) — even though BTC's current price of $63,800-$64,200 is ~10% higher than July 1.
This suggests two things:
- Sentiment is extremely pessimistic — approaching bottom-zone sentiment levels
- Price-sentiment divergence — BTC at $64K is $6K higher than $57,950, but sentiment is almost equally pessimistic — indicating the market is dissatisfied with the "quality" of the rally (catalyst-driven rather than fundamentally driven)
A Fear and Greed reading of 28 is a two-way signal: it is both a sign of excessive market pessimism (contrarian buying opportunity) and a confirmation of weak short-term momentum (no incremental capital inflow). For different trading styles — the former appeals to bottom-fishers, the latter is a warning for trend traders. 5
VI. ETH / SOL / XRP Technical Analysis
ETH
| Dimension | Data |
|---|---|
| Current Price | ~$1,854-$1,925 |
| 24h Change | 📉 -1.5% to -2% |
| RSI (14) | ~35-40 — weak |
| ETH/BTC | ~0.029 — continuing to weaken |
| Key Support | $1,830 — if lost -> $1,750 |
| Key Resistance | $1,950 — break above -> $2,000 |
| Level | Price | Significance |
|---|---|---|
| Resistance 2 | $2,000-$2,100 | Requires BTC stability + capital rotation |
| Resistance 1 | $1,950-$1,954 | 7-week resistance zone — not yet broken |
| Current | ~$1,854-$1,925 | Weak oscillation |
| Support 1 | $1,830-$1,880 | Short-term support |
| Strong Support | $1,750-$1,800 | Bottom range |
The ETH/BTC exchange rate continues weakening to ~0.029, showing ETH is underperforming BTC in this downturn — when BTC bounces, ETH follows weakly; when BTC declines, ETH follows fully. ETH's relative weakness may persist until BTC completes its bottom confirmation. 6
SOL
| Dimension | Data |
|---|---|
| Current Price | ~$73-$77 |
| 7-Day Change | 📉 -1.81% |
| vs ATH | -74% ($294.33 -> ~$75) |
| RSI | ~52.83 — neutral |
| 20/50-Day MA | ~$76.80 — converging, nearing direction choice |
| Fear and Greed | 33 (Fear) |
SOL bright spot: Despite the 74% decline from ATH, SOL ETF inflows continue — forming a "price decline vs. institutional inflow" divergence pattern.
XRP
| Dimension | Data |
|---|---|
| Current Price | ~$1.08-$1.13 |
| 7-Day Change | 📉 -0.26% |
| vs ATH | -70% ($3.65 -> ~$1.10) |
XRP's unique position:
- Positives piling up: Ripple lawsuit largely settled, 7 spot XRP ETFs AUM exceeding $1B, RLUSD stablecoin expansion
- Price not reacting: Has not kept pace with positive catalysts — needs overall market sentiment to improve
- Short-term catalyst: July 26 SEC settlement conference — could release more certainty
- Medium-term headwind: CLARITY Act delay directly hits XRP's reclassification prospects as a digital commodity 7
VII. Macroeconomic Panorama
| Dimension | Latest Data | BTC Impact |
|---|---|---|
| Oil | Brent $97-$98/barrel — retreat from $100+ | 🟢 Macro pressure easing |
| 10-Year Treasury | ~4.31% — down from 4.70% | 🟢 Improving |
| 30-Year Treasury | 5.25% — still elevated | 🔴 Continued pressure |
| S&P 500 | Weekly decline — tech $800B sell-off | 🔴 Risk sentiment weak |
| Dollar Index | Slight retreat from highs | 🟢 BTC headwind easing |
| Korean Kimchi Premium | BTC -0.81% (negative premium) | 🔴 Asian retail sentiment weak |
| Bitstamp Mt. Gox | Started creditor BTC/BCH/ETH distribution | 🔴 Potential selling pressure |
VIII. FOMC Preview — 3 Days Countdown
Latest Probability Distribution
| Scenario | Polymarket Odds | Driving Factor |
|---|---|---|
| Hold Rates | ~70% | Oil retreat + CPI 2.9% below expectations (June data) |
| Hike 25bp | ~30% | Oil $100 shock + inflation expectation risk |
| Rate Cut | <3% | No possibility |
FOMC Market Impact
| FOMC Outcome | BTC Impact |
|---|---|
| Hold + Dovish Statement | 🟢 BTC could bounce to $65K-$66K — removes short-term biggest uncertainty |
| Hold + Hawkish Statement | 🟡 BTC consolidates at $63K-$64K — remains constrained by high-rate environment |
| Hike 25bp | 🔴🔴 BTC could fall to $60K-$62K — black swan scenario (~30% probability) |
Against the backdrop of CLARITY delay, ETF outflows, and Fear and Greed at 28, FOMC is the only catalyst that could turn the tide next week — but only if it leans dovish. If FOMC unexpectedly turns hawkish, $62K will face a serious test. 8
IX. What BTC Dominance at 65% Means
BTC dominance pulling back from yesterday's 68%+ to ~65%, but still elevated:
- Altcoins not receiving capital inflows — BTC dominance retreat is due to BTC declining, not capital flowing from BTC to alts
- BTC remains the "safe haven" — within crypto, BTC is treated as the relatively safer asset
- ALT/BTC pairs broadly declining — ETH/BTC, SOL/BTC etc. continuing to weaken
- Beware the BTC dominance retreat trap — if BTC dominance falls quickly (<60%) while BTC price does not rise, it means capital is not rotating, but fleeing the crypto market entirely
X. Key Calendar for the Week Ahead
| Date | Event | Impact Level | Current Status |
|---|---|---|---|
| Jul 25-27 | BTC Conference (Weekend) | ⭐⭐⭐ | Sell-the-event curse — already declined |
| Jul 26 | SEC v XRP Settlement Conference | ⭐⭐⭐ | Regulatory signal — watch |
| Jul 28-29 | 🔥🔥🔥 FOMC Rate Decision | ⭐⭐⭐⭐⭐ | Most critical event — rate hike odds 30% |
| Jul 31 | BTC monthly close | ⭐⭐⭐⭐ | Monthly candle likely red (from $73K+ -> $64K) |
| Aug 7 | Congress recess deadline — CLARITY final window | ⭐⭐⭐⭐⭐ | If missed, CLARITY delayed to Sep-Nov |
Scenario Analysis
| Scenario | Probability | BTC Target Range | Trigger |
|---|---|---|---|
| 📉 Further decline to $62K-$63K | ~40% | $61K-$63K | FOMC hawkish / CLARITY delay confirmed / ETF outflows intensify / Mt.Gox distribution selling |
| ➡️ $63K-$65K range consolidation | ~35% | $64K+-$1K | FOMC holds rate + ETF outflows narrow + oil stabilizes at $95-$100 |
| 📈 Oversold bounce to $65K-$66K | ~25% | $64.5K-$66K | FOMC dovish / CLARITY surprise positive / ETF re-inflows |
⚠️ Risk Disclaimer: The above analysis is a deep market interpretation and does not constitute investment advice. BTC broke below $64K today (low $63,666), erasing nearly all $65K-$66K gains since July 22. The 7-day ETF inflow streak ended with $225M in outflows (IBIT -$202.5M). CLARITY hopes dashed by Thune saying it's unlikely before recess. Oil retreating from $100+ to $98 is one of the few positives. Fear and Greed at 28, approaching Extreme Fear. FOMC (July 28-29) is the core risk event. Cryptocurrency markets are extremely volatile — manage risk carefully.
Recommended: Binance Registration | OKX Registration
📚 Further Reading: On-Chain Guide - Blockchain from Zero — Blockchain technology introduction and on-chain data analysis tutorials
📖 Related reads:
Footnotes:
Footnotes
-
Source: TradingView BTC/USD 4H chart data; Gate.io BTC technical analysis, July 25, 2026 ↩
-
Source: Baiyi "Bitcoin ETF Outflows Hit $225M, Ending Seven-Day Inflow Streak"; CoinCodex "Bitcoin ETFs Near $1 Billion," July 25, 2026 ↩
-
Source: Crypto.news "John Thune shuts down hopes for CLARITY Act vote"; Odaily "US Senate Likely Unable to Pass CLARITY Act Before Summer Recess," July 24-25, 2026 ↩
-
Source: Brent crude oil price data; Polymarket FOMC prediction odds, July 25, 2026 ↩
-
Source: Alternative.me Fear and Greed Index data, July 25, 2026 ↩
-
Source: TradingView ETH/USD and ETH/BTC exchange rate data, July 25, 2026 ↩
-
Source: Baiyi "XRP Has All the Bullish Catalysts — Why Isn't the Price Reacting?"; Investing.com SOL analysis, July 25, 2026 ↩
-
Source: Polymarket FOMC prediction odds; Weiss Ratings "Has Bitcoin Already Bottomed?," July 25, 2026 ↩