
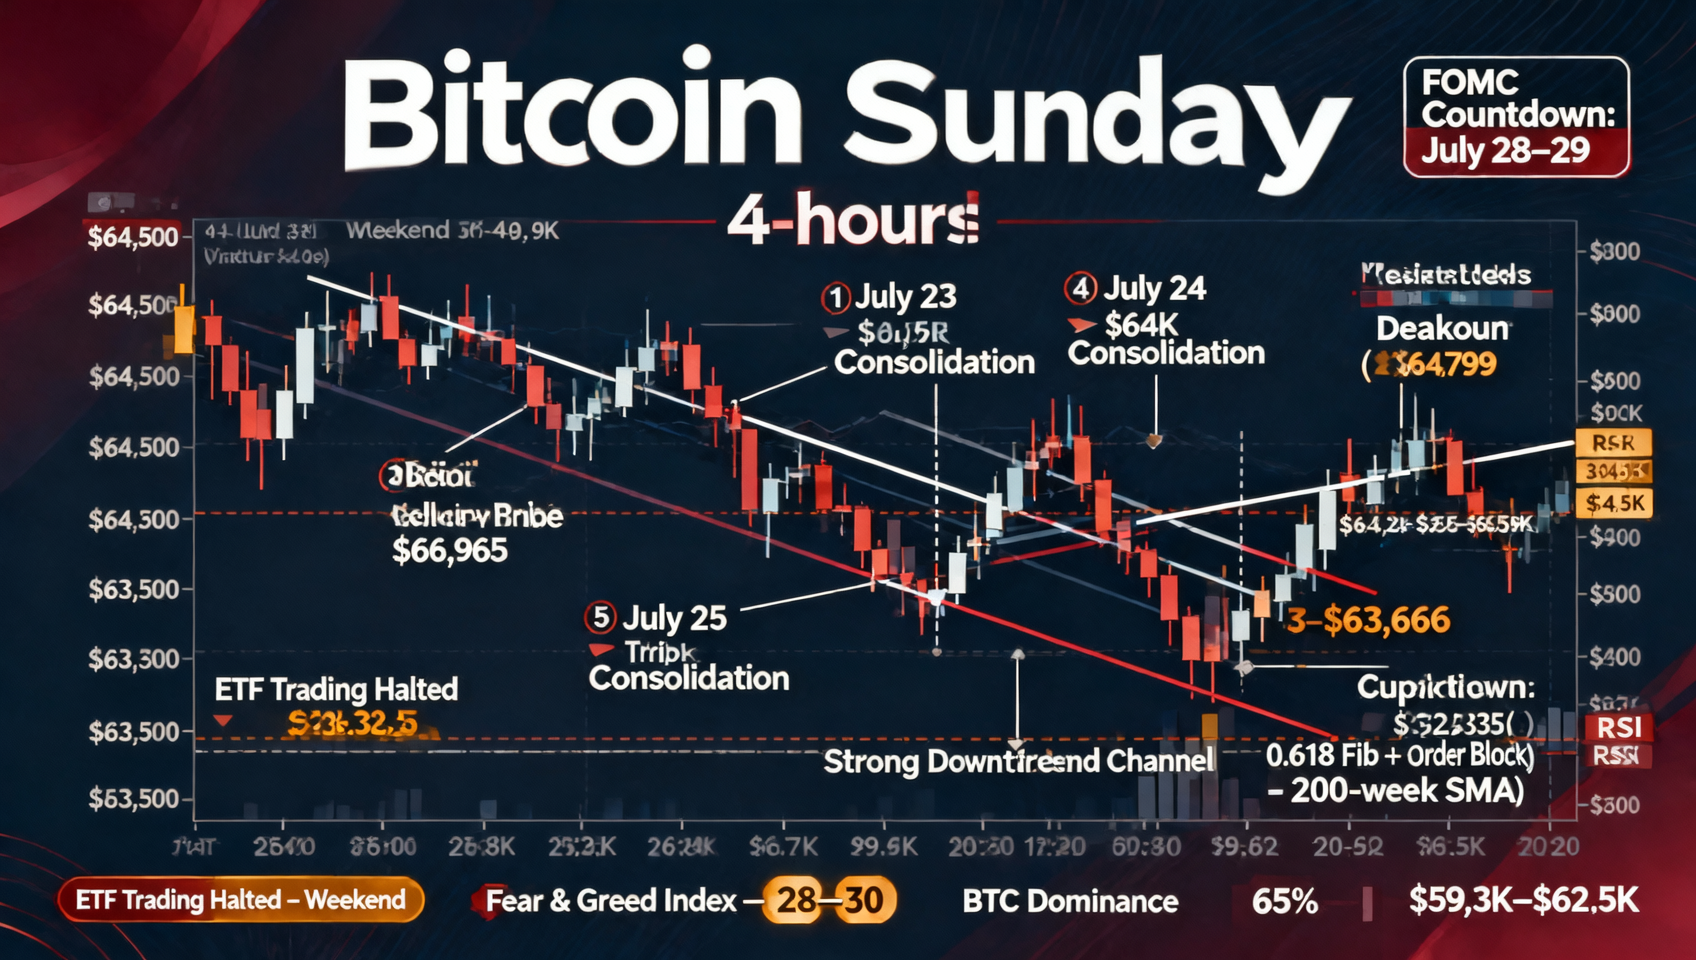
July 26 Market Analysis: BTC Weekend Low-Volume Consolidation at $63.5K-$64.5K — FOMC 2-Day Countdown, 4H Downtrend Channel Intact, $64K Bull-Bear Divide
Bitcoin trades in a tight $63,500-$64,500 range on Sunday with significantly reduced volume, continuing consolidation after the July 25 breakdown below $64K. U.S. equity markets are closed, spot BTC ETFs are halted, and CME Bitcoin futures are inactive—significantly reducing market liquidity. The 4-hour downtrend channel remains intact with $64,000 as the key bull-bear dividing line. Fear & Greed Index holds at 28-30 (Fear) with heavy wait-and-see sentiment. The FOMC rate decision enters its final 2-day countdown with Polymarket pricing ~70% hold-steady and ~30% hike probability. Key technical support at $62,335 (0.618 Fibonacci + order block), strong support at $59K-$62.5K (200-week MA zone). ETH, SOL, and XRP follow BTC in narrow consolidation.
July 26 Macro Data Overview
| Indicator | Value | Status |
|---|---|---|
| BTC Price | ~$63,500-$64,500 | ➡️ Low-volume consolidation |
| ETH Price | ~$1,850-$1,920 | ➡️ Following consolidation |
| SOL Price | ~$73-$77 | ➡️ Range compressed |
| XRP Price | ~$1.08-$1.13 | ➡️ Narrow chop |
| Total Market Cap | ~$2.18T | ➡️ Slight fluctuation from Friday |
| BTC Dominance | ~65% | ➡️ Remains elevated |
| Fear & Greed | 28-30 (Fear) | 🔴 Heavy wait-and-see |
| RSI (14D) | ~38-40 | 🟡 Weak zone—hasn't recovered to neutral |
| ETF Weekend Status | Halted | ⏸️ No institutional flow visibility |
| Volume | Significantly reduced | ⬇️ Down 30-40% from Friday |
| Brent Crude | ~$97-$98/barrel | 🟢 Holding retreat |
| 10Y Treasury Yield | ~4.31% | ➡️ Stable |
| 30Y Treasury Yield | 5.25% | ⚠️ Key level |
1. BTC Technical Analysis—Key Levels in Weekend Chop
Price Evolution (July 22–Present)
| Phase | Date | Price Range | Characteristic |
|---|---|---|---|
| Breakout Rally | July 22 | $65,000→$66,965 | High volume breakout—ETF buying + CLARITY expectations |
| High Consolidation | July 23 | $66,000-$66,500 | Narrow range—awaiting CLARITY vote |
| Triple-Headwind Pullback | July 24 | $66,965→$64,799 | Oil $100+ / CLARITY delay / FOMC hike odds 40% |
| Breakdown Below $64K | July 25 | $65,705→$63,666 | Fake breakout→sharp dump→$64K lost |
| Weekend Low-Volume Chop | July 26 (Today) | $63,500-$64,500 | Consolidation—awaiting FOMC direction |
Key Level Structure
| Price Range | Marker | Significance |
|---|---|---|
| $66,200-$66,965 | 🔴 | July 22 breakout zone—left behind |
| $65,500-$65,800 | 🔴 | Key resistance—July 25 fakeout touched $65,705 |
| $65,000-$65,300 | 🔴 | Former support→new resistance—$65K psychological |
| $64,200-$64,500 | 🔴 | Short-term resistance—above $64K |
| $63,500-$64,500 | ➡️ | Current range—weekend chop |
| $63,000-$63,500 | 🟢 | Buffer support |
| $62,335 | 🟡 | Key support—0.618 Fibonacci + 4H order block |
| $61,400-$62,000 | 🟡 | Deepened pullback zone |
| $59,356-$62,492 | 🟢 | 200-week MA zone—bull-bear boundary |
Technical Indicator Status
| Indicator | Current | Interpretation | Signal |
|---|---|---|---|
| RSI (14D) | ~38-40 | Stalled after recovering from 27—weak zone | ➡️ Neutral-bearish |
| MACD | Fast line below zero | Momentum still negative—but decline slowing | 🔴 Bearish |
| Volume | Significantly reduced | Weekend low volume—directional decision delayed | ➡️ Wait-and-see |
| 4H Candle Structure | Downtrend channel running | Step-down from $65,808 high | 🔴 Bearish |
| BTC Dominance | ~65% | Remains elevated—no altcoin rotation yet | ➡️ Risk-off |
RSI 38-40 Interpretation
RSI recovered from 24 (oversold) on July 24 to the current 38-40 range but stalled, failing to reach the 50 neutral level. This indicates:
- Oversold Recovery Phase One Complete—The bounce from 27 to 40 was technical repair
- Recovery Strength Insufficient—40 is in the weak zone, showing limited bullish power
- Direction Pending—If RSI breaks above 45 and holds, a $65K rebound is possible; if it falls back below 35, the $62,335 support will be tested
RSI 38-40 is an "in-between zone"—neither oversold (no urgent rebound need) nor strong (no sustained upward momentum). Before the FOMC result, RSI may continue hovering in this range.1
4-Hour Downtrend Channel
On the 4-hour chart, BTC's step-down downtrend channel from the $65,808 high continues through the weekend:
- Channel Upper Bound: $65,808→$65,705→$65,200→$64,500 (progressively lower)
- Channel Lower Bound: $64,799→$63,666→$63,500 (progressively lower)
- Current: In $63,500-$64,500 range—near channel midline
If BTC:
- Holds $63,500 → Possible correction to $64,200-$64,500 (channel midline test)
- Breaks $64,500 → Could test $65,000 (channel upper bound)
- Loses $63,500 → Next target $62,335 (0.618 Fibonacci)
2. 🏦 ETF Weekend Halt—Institutional Flows Paused
Weekend ETF Halt Impact
| Dimension | Weekday (U.S. Markets Open) | Weekend (U.S. Markets Closed) |
|---|---|---|
| Institutional Buy Channel | BlackRock IBIT etc. open | Halted |
| Institutional Sell Channel | Redemptions open | Halted |
| Daily Net Flow Observation | Available (key market indicator) | None |
| Direct BTC Price Impact | ETF net inflow→price support | No direct ETF impact |
| Liquidity | High—ETF + futures + spot | Low—spot market only |
Friday Flat ETF Flows Significance
Friday's roughly $0 net ETF flows (essentially flat) is noteworthy:
- Not Continued Outflows—Thursday's $225M outflow did not extend into Friday
- Not Renewed Inflows—No new net buying either
- Wait-and-See Mode—Aligns with the broader market's pre-FOMC caution
Friday's flat ETF flows suggest institutional investors are also waiting for the FOMC result before making directional decisions. The first hour of ETF flows after Monday's reopening will be a critical indicator of institutional reaction to the FOMC outcome.2
3. 🏛️ FOMC Forward Look—2-Day Countdown
Latest Probability Distribution
| Scenario | Polymarket Probability | Driving Factors |
|---|---|---|
| Hold Steady | ~70% | Oil retreat + CPI 2.9% below expectations |
| Hike 25bp | ~30% | Oil $100 shock + inflation expectation risk |
| Cut Rates | <3% | No chance |
FOMC Market Impact Scenarios
| FOMC Result | BTC Impact | Probability |
|---|---|---|
| Hold steady + dovish statement | 🟢 Rally to $65K-$66K—removes biggest short-term uncertainty | ~45% |
| Hold steady + hawkish statement | 🟡 Consolidate $63K-$64K—still constrained by high rates | ~25% |
| Hike 25bp | 🔴🔴 Could drop to $60K-$62K—black swan scenario | ~30% |
Key Focus Points
- Rate Decision Itself—Hold steady is fully priced in; surprise probability low
- Statement Wording—Whether oil's inflation impact is labeled "transitory" vs "persistent"
- Powell Press Conference—Hints on future rate path (dot plot, economic projections)
- Market Interpretation—Even a hold-steady with hawkish wording could trigger selling
With CLARITY Act delayed, ETF inflows reversed, and Fear & Greed at 28-30, the FOMC is the only catalyst next week that can significantly shift market direction. However, even a dovish FOMC result requires renewed ETF inflows to confirm a sustainable BTC breakout above $65K-$66K.3
4. 😨 Fear & Greed 28-30—Market Sentiment Signal
Fear & Greed Trajectory
| Date | Index | Zone |
|---|---|---|
| July 1 (Low $57,950) | 25 | 🔴 Extreme Fear |
| July 22 (Broke $65K) | 33 | 🔴 Fear |
| July 24-25 (Below $64K) | 28-31 | 🔴 Fear |
| July 26 (Weekend) | 28-30 | 🔴 Fear—wait-and-see |
28-30 Meaning
Fear & Greed at 28-30 indicates "fear but not yet panic" sentiment:
- vs. July 1 Bottom—July 1 at $57,950 the index was 25; current $63,500-$64,500 is $6K+ higher, yet sentiment is almost equally pessimistic
- Price-Sentiment Divergence—This divergence usually signals market dissatisfaction with current price levels (lacks quality upward momentum)
- Two-Way Signal—For value investors, 28-30 is a contrarian accumulation zone; for trend traders, it's trend-weakness confirmation
Over the FOMC weekend, Fear & Greed holding at 28-30 is rational—markets avoid excessive optimism or pessimism before a major event. If FOMC is dovish, this index could quickly rebound to 35-40 (neutral-bullish); if hawkish, it may drop below 25 (extreme fear).4
5. 💎 ETH/SOL/XRP Technical Analysis
ETH
| Dimension | Value |
|---|---|
| Current Price | ~$1,850-$1,920 |
| RSI (14D) | ~35-40—weak |
| ETH/BTC | ~0.029—continued weakness |
| Key Support | $1,830—loss opens $1,750 |
| Key Resistance | $1,950—break targets $2,000 |
ETH/BTC ratio holds near ~0.029, showing continued ETH weakness vs. BTC. ETH's relative underperformance may persist until BTC completes its bottoming process.
SOL
| Dimension | Value |
|---|---|
| Current Price | ~$73-$77 |
| vs. ATH | -74% ($294.33→~$75) |
| RSI | ~52—neutral |
| 20D/50D MAs | ~$76.80—converging |
SOL's 20-day and 50-day moving averages converge near $76.80, approaching a directional decision. The SOL ETF inflow vs. price decline divergence needs next-week confirmation.
XRP
| Dimension | Value |
|---|---|
| Current Price | ~$1.08-$1.13 |
| vs. ATH | -70% ($3.65→~$1.10) |
| Bullish Factor | 7 spot ETFs' AUM exceeds $1B |
XRP consolidates with the broad market. The Ripple-SEC case was substantially concluded in 2025; XRP's price action is now more driven by overall market sentiment and CLARITY Act progress.5
6. 🌍 Macro Economic Overview
| Dimension | Latest Data | BTC Impact |
|---|---|---|
| Oil | Brent $97-$98/barrel—holding retreat | 🟢 Macro pressure easing |
| 10Y Treasury | ~4.31%—stable | ➡️ Neutral |
| 30Y Treasury | 5.25%—key level | 🔴 Persistent pressure |
| S&P 500 | Stabilizing after weekly decline | ➡️ Wait-and-see |
| US Dollar Index | Slight retreat from highs | 🟢 Reduced BTC pressure |
| Korea Kimchi Premium | Inverse premium | 🔴 Weak Asian retail sentiment |
7. 🔮 Scenario Analysis—Three Post-FOMC Paths
| Scenario | Probability | BTC Target Range | Trigger Conditions |
|---|---|---|---|
| 📉 Continued drop to $62K-$63K | ~35% | $61K-$63K | Hawkish FOMC / rate hike / ETF outflows resume |
| ➡️ Consolidate $63K-$65K | ~40% | $63.5K-$64.5K | Hold steady + neutral statement |
| 📈 Oversold bounce to $65K-$66K | ~25% | $64.5K-$66K | Dovish FOMC + ETF inflows resume |
8. Next Week Key Calendar
| Date | Event | Impact Level |
|---|---|---|
| July 27 | Bitcoin Conference day three | ⭐⭐⭐ |
| July 28-29 | 🔥🔥🔥 FOMC Rate Decision | ⭐⭐⭐⭐⭐ |
| July 31 | BTC Monthly Close | ⭐⭐⭐⭐ |
| August 7 | Congressional recess deadline—CLARITY last window | ⭐⭐⭐⭐⭐ |
⚠️ Risk Disclaimer: This analysis is for informational purposes only and does not constitute investment advice. BTC is consolidating in a $63,500-$64,500 range over the weekend with low volume. The 4-hour downtrend channel remains intact with $64,000 as the key bull-bear dividing line. The FOMC (July 28-29) enters its final 2-day countdown and is the most critical risk event next week. ETFs are halted over the weekend. Fear & Greed holds at 28-30 (Fear). Crypto markets are highly volatile—please manage risk accordingly.
📚 Further Reading: On-Chain Guide - Blockchain from Zero — Blockchain fundamentals and on-chain data analysis tutorials
📖 Related Articles:
Footnotes:
Footnotes
-
Source: TradingView BTC/USD 4H chart data; RSI indicator analysis, July 26, 2026 ↩
-
Source: SoSoValue ETF flow data; CoinCodex ETF data, July 25-26, 2026 ↩
-
Source: Polymarket FOMC odds; Cointelegraph "FOMC Preview July 2026," July 26, 2026 ↩
-
Source: Alternative.me Fear & Greed Index data, July 26, 2026 ↩
-
Source: TradingView ETH/USD, SOL/USD, XRP/USD data; The Defiant "Ripple Settles SEC Lawsuit," July 26, 2026 ↩