
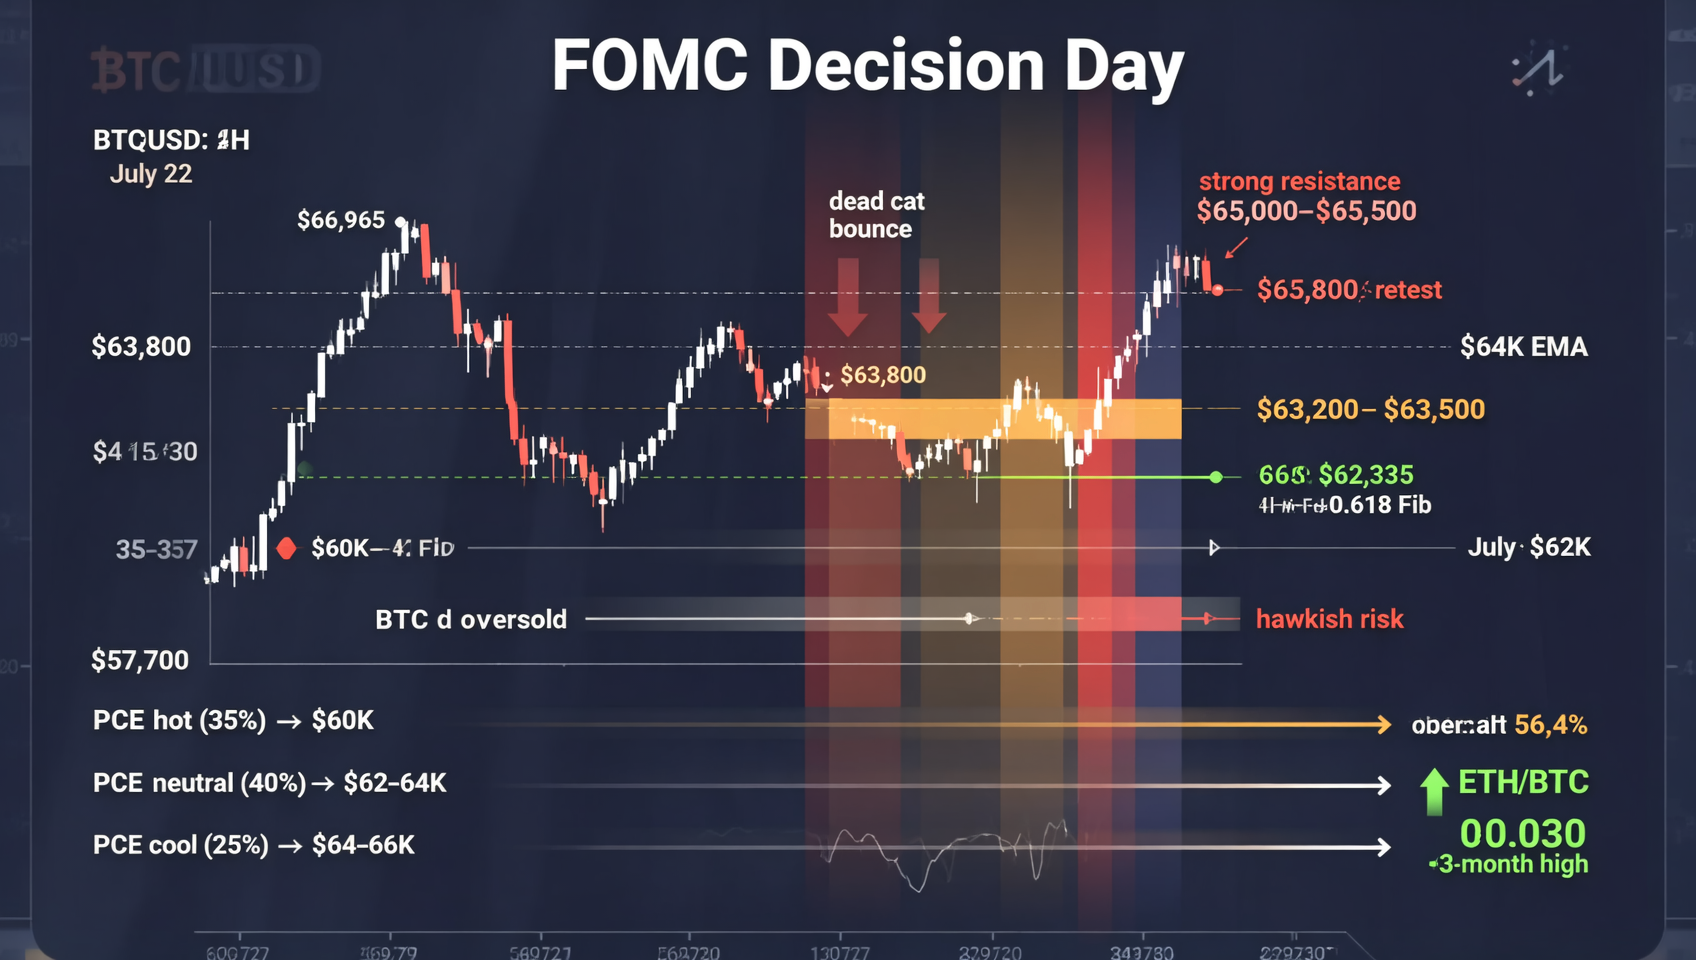
July 29 Market Analysis: FOMC Decision Day — BTC Under Pressure at $63K, Hawkish Hold Suppresses Rally, $62K-$65K Range Awaits PCE Data and Tech Earnings
FOMC holds rates at 3.50%-3.75% but delivers a hawkish tone. Warsh refuses to rule out a September hike, pushing September hike probability from 36% to ~80%. BTC trades in the $63,200-$63,800 range — the post-announcement bounce to $63,800 faded quickly, failing to reclaim $64K and confirming $65K-$65,500 as strong resistance. RSI drops from 38 to 35-37 with weakening momentum, MACD death cross persists, price below daily Bollinger mid-band. BTC dominance falls from 59% to 56.4%, while ETH/BTC at ~0.030 (3-month high) provides structural support. $6.79B in total liquidations (79% longs) clean out leverage. Fidelity Q3 report flags ETH in 'capitulation zone' with historical analog of 70% median 1-year return. Key support at $62,335 (0.618 Fibonacci) — if lost, $60K-$62K is the next defense zone. Tomorrow's PCE+Q2 GDP data double-header will determine the post-FOMC market direction.
July 29 Macro Data Overview
| Indicator | Value | Status |
|---|---|---|
| BTC Price | ~$63,200-$63,800 | 🔴 FOMC decision day pressure — brief bounce to $63,800 failed to hold $64K |
| ETH Price | ~$1,875-$1,892 | 🔴 -3.5% — following market but ETH/BTC at 3-month high |
| SOL Price | ~$74 | 🔴 -3.4% — Fidelity flags "capitulation zone" |
| XRP Price | ~$1.06 | 🔴 -4% — CLARITY Act deadlock weighs |
| Total Market Cap | ~$2.18T | 🔴 Declined from yesterday |
| BTC Dominance | ~56.4% | ➡️ Down from 59% — ETH/BTC strength persists |
| Fear & Greed Index | 28 (Fear) | 🔴 July low — extreme caution |
| RSI (14) | ~35-37 | 🔴 Down from 38 — weakness intensifying |
| ETF Status | $465M net outflow (Jul 23-24) | 🔴 Institutions de-risked before FOMC |
| 24h Volume | Elevated with selling | 🔴 $6.79B liquidations amplify volume |
| FOMC Decision | Hold at 3.50%-3.75% | 🟡 As expected but hawkish tone |
| WTI Crude | Below $80/bbl | 🟢 US-Iran ceasefire hopes |
| NVIDIA | -4.99% to $196.51 | 🔴 Semiconductor crash accelerating |
| ETH/BTC | ~0.030 (3-month high) | 🟢 ETH relative strength continues |
I. BTC Technical Analysis — Post-FOMC Can't Break $64K
Price Evolution (July 22 to Present)
| Phase | Time | Price Range | Characteristic |
|---|---|---|---|
| Rally to $66K | July 22 | ~$66,965 | CLARITY Act boost + Short Squeeze |
| Stepwise Decline | Jul 23-26 | $66,965→$63,500 | CLARITY delay + FOMC fears + oil spike |
| Short Bounce | July 27 | $63,500→$65,387 | Iran ceasefire + squeeze |
| FOMC Day 1 Drop | July 28 | $65,387→$63,414 | FOMC opens + ETF outflows |
| FOMC Decision Day | July 29 | $63,200-$63,800 | Hawkish hold fails to generate buying |
| Post-Announcement | 2:00 PM ET+ | $63,200→$63,800→faded | Weak bounce exhausted |
Key Level Structure
| Price Zone | Signal | Description |
|---|---|---|
| $66,965 | 🔴 | July 22 high — medium-term strong resistance |
| $65,500-$66,000 | 🔴 | Short squeeze cluster — heavy shorts above $65K |
| $65,000-$65,500 | 🔴 | Confirmed strong resistance — two failed attempts |
| $64,500 | 🔴 | 4H EMA20 — not reclaimed post-FOMC |
| $63,791 | 🔴 | Post-FOMC brief high — invalid as support |
| $63,200-$63,500 | 🟡 | Current consolidation zone — waiting for PCE |
| $62,335 | 🟢 | 0.618 Fibonacci + 4H order block — key defense |
| $60,000-$62,000 | 🟢 | Strong support band — analyst consensus downside target |
| $59,356-$62,492 | 🟢 | 200-week MA zone — bull-bear boundary |
| $57,700 | 🟢 | July low — break below confirms bear continuation |
Technical Indicators
| Indicator | Current Value | Reading | Signal |
|---|---|---|---|
| RSI (14) | ~35-37 | Down from 38 — weakening — approaching oversold at 30 | 🔴 Bearish |
| MACD (4H) | Fast below slow, diverging | Death cross confirmed — bearish momentum intact | 🔴 Bearish |
| Volume | Elevated + liquidations | $6.79B liquidations clearing leverage — selling with volume | 🔴 Bearish |
| BTC Dominance | ~56.4% | Down from 59% — capital still flowing to ETH | 🟡 ETH strength |
| Bollinger Bands (Daily) | Price below mid-band | Lower band at ~$60,500 — room to fall | 🔴 Bearish |
RSI 35-37 Technical Implications
RSI at 35-37 signals:
- Approaching but not in oversold — 5-7 points from oversold at 30, short-term downside potential remains
- Comparison to July 23 RSI 27 — BTC hit $63,500 on July 23 with RSI at 27 (oversold). Current RSI 35-37 means weakness exists but not yet at extreme levels
- Oversold bounce conditions building — if PCE data or tech earnings provide a positive catalyst, RSI has room to bounce from 35
- No post-FOMC improvement — the rate hold's positive impact was fully negated by the hawkish tone
RSI at 35-37 indicates BTC is weak but not extreme. The critical observation window opens after the July 30 PCE release — below-consensus PCE could push RSI to 40+; above-consensus PCE could drive RSI below 30 into deep oversold. 1
4H Chart — Weak Bounce Post-FOMC
Following the FOMC announcement (2:00 PM ET), BTC briefly lifted from $63,200 to $63,800 before fading back to ~$63,500, forming a classic Dead Cat Bounce:
- Bounce amplitude: Only +0.9% ($600)
- Duration: ~30 minutes before fading
- Volume profile: Initial spike on the announcement but buying failed to sustain
- Conclusion: Markets viewed the FOMC hold as "expected" — no new buying emerged. Funds are waiting for PCE data and tech earnings.
II. 💎 ETH Technical Analysis — Relative Strength Intact
ETH Technical Snapshot
| Dimension | Data |
|---|---|
| Current Price | ~$1,875-$1,892 |
| 24h Change | -3.5% — manageable decline |
| RSI (14) | ~40-42 — above BTC's 35-37 — relative strength |
| ETH/BTC | ~0.030 — 3-month high — above 200 DMA |
| July Return | +24% — far exceeds BTC's +10% |
| Key Support | $1,830 — tested and held on July 25 |
| Key Resistance | $1,950-$1,970 — 10-week high zone |
Evidence of ETH Relative Strength
Despite ETH's -3.5% decline on July 29, structural advantages remain intact:
- RSI 40-42 > BTC 35-37 — ETH's RSI remains structurally higher
- ETH/BTC above 200 DMA — even on FOMC day, the breakout structure holds
- July return +24% vs BTC +10% — monthly performance gap persists
- ETF inflows $103.9M — contrasting with BTC ETF outflows
- Fidelity "capitulation zone" signal — institutional long-term constructive view
Under dual pressure from a hawkish FOMC and semiconductor crash, ETH/BTC still holds above the 200 DMA and the 0.030 level — the most important bullish signal in the current bearish environment. If ETH can reclaim $1,900+ with RSI improving, it is likely to lead any rebound. 2
ETH/BTC 200 DMA Holds
ETH/BTC broke above the 200 DMA on July 28 and held above it on July 29 even during the broader market decline. Historical data:
| Date | ETH/BTC Broke 200 DMA | Subsequent 3M ETH Relative Performance |
|---|---|---|
| June 2023 | ✅ Breakout | ETH outperformed BTC by +35% |
| November 2024 | ✅ Breakout | Launched 4-month altcoin rotation |
| September 2025 | ❌ Breakdown | ETH weak for 8 months |
| July 2026 (Current) | ✅ Breakout Confirmed | TBD |
III. 📊 Multi-Dimensional Market Assessment
| Dimension | Score | Notes |
|---|---|---|
| Technical | 🟡 4/10 | BTC weak consolidation at $63K — RSI 35-37 — $62K support tested |
| ETF Flows | 🔴 3/10 | BTC ETF $465M outflow — no institutional return post-FOMC |
| Macro Variables | 🟡 5/10 | Hawkish FOMC hold — Sept hike 80% — PCE pending |
| Market Sentiment | 🔴 2/10 | Fear & Greed 28 — July low — panic intensifying |
| On-Chain Data | 🟡 5/10 | $6.79B liquidations clear leverage — ETH/BTC breakout provides structural support |
| Structural Narrative | 🟡 5/10 | ETH relative strength — Polygon upgrade — but CLARITY still deadlocked |
| Composite Score | 4.0/10 | Bearish — waiting for PCE validation — no clear bullish catalyst short-term |
IV. 🏦 Position Distribution — $6.79B Liquidation Clears the Market
Post-Liquidation Market Structure Changes
The $6.79B total liquidation (79% longs) has materially changed market structure:
| Change | Impact |
|---|---|
| Leverage Cleaned Out | Perpetual funding rates turned negative — excessive leverage removed |
| Open Interest (OI) Declined | Both BTC and ETH OI dropped significantly — speculation cooling |
| Futures Basis Narrowed | Annualized basis from 10-15% to 3-5% — arbitrage compress |
| Stablecoins Flowing to Exchanges | Some stablecoin inflow — potential bottom-fishing capital |
Positive Signal: Post-Liquidation Markets Tend to Bottom
Historical data shows that markets often find short-term bottoms within 1-2 weeks after major liquidation events:
- October 2025: $1.2B liquidation → BTC rallied +35% in 3 weeks
- March 2026: $800M liquidation → BTC rallied +20% in 2 weeks
- June 2026: $4.5B liquidation → BTC bounced from $59K to $66K in 1 month
The $6.79B liquidation on July 29 is one of the largest of 2026. On the positive side, excessive leverage has been cleared, giving the market a "cleaner slate." However, liquidation alone is insufficient to form a bottom — genuine buying catalysts (weak PCE or institutional return) are needed. 3
Whale vs Retail Divergence
CryptoQuant data shows continued behavioral divergence between whales and retail:
| Group | Behavior | Implication |
|---|---|---|
| Whales (>1,000 BTC) | Reducing exchange deposits | Whales reducing activity before FOMC — waiting |
| Retail (<10 BTC) | Increasing exchange deposits | Retail moving BTC to exchanges in panic — potential sell pressure |
| Stablecoin Reserves (Exchange) | Slight increase | Potential buying power not yet deployed |
V. 🏛️ Post-FOMC Scenario Analysis
September Hike Probability at ~80%
With the FOMC hold behind us, attention turns to the September 17 meeting. Current CME FedWatch shows September hike probability at ~80% — an unusually high pre-commitment level, meaning the market has already priced in a September hike as the base case.
Two-Week Scenario Analysis
| Scenario | Prob | BTC Target | Trigger |
|---|---|---|---|
| 📉 PCE Hot + Earnings Disappoint → Test $60K | ~35% | $60K-$62K | PCE >+0.1% MoM + tech earnings disappoint AI |
| ➡️ PCE In-Line + Neutral Earnings → Range | ~40% | $62K-$64K | PCE +0.1% MoM, 3.3% YoY — wait for August catalysts |
| 📈 PCE Cool + Tech Strong → Bounce $65K | ~25% | $64K-$66K | PCE <+0.1% MoM + AI capex validated |
| 🚀 CLARITY Breakthrough + Dovish PCE → Surge | ~5% | $65K-$67K | ETH/BTC continues breakout + regulatory catalyst |
Catalyst Timeline
July 29 (Today)   FOMC Decision (DONE) → Market digests hawkish tone
July 30           June PCE + Q2 GDP → Inflation + growth double verification
July 30-31        MSFT/META Earnings → AI stock direction
July 31           AAPL/AMZN Earnings → Tech sector tone-setter
July 31-Aug 1     $13-14B Options Expiry → Volatility event
July 31           BTC Monthly Close → Sets August tone
Aug 7             CLARITY Act Window → Regulatory catalyst
VI. ⚠️ Key Risk Factors
- Hawkish FOMC Tone Lingers: Warsh refused to rule out September hike — rate path uncertainty will continue to suppress risk assets
- Semiconductor Correction Not Over: SOX down 20%+ — if MSFT/META earnings can't lift AI stocks, correction may continue
- BTC ETF Outflows Unreversed: $465M outflow shows no sign of reversal — institutions waiting for clearer direction
- CLARITY Act Deadlock: August 7 recess deadline approaches — bill may lose 2026 passage opportunity
- PCE Uncertainty: June core PCE expected +0.1% MoM — hot print would push September probability from 80% to 90%+
⚠️ Risk Disclaimer: This analysis is for informational purposes only and does not constitute investment advice. The FOMC held rates but delivered a hawkish tone suppressing risk assets. BTC remains pressured at $63K, semiconductor stocks continue crashing, ETF outflows persist, and the Fear & Greed Index at 28 marks a July low. Tomorrow's PCE data and tech earnings will determine the next directional move. Cryptocurrency markets are extremely volatile — please manage your risk carefully.
Recommended Exchanges:
📚 Further Reading: On-Chain Guide — Learn Blockchain from Scratch — Blockchain technology tutorials and on-chain data analysis
📖 Related Articles:
- July 28 Crypto Market Deep Analysis
- July 28 Crypto News Deep Review
- July 27 Crypto Market Deep Analysis
Footnotes: