
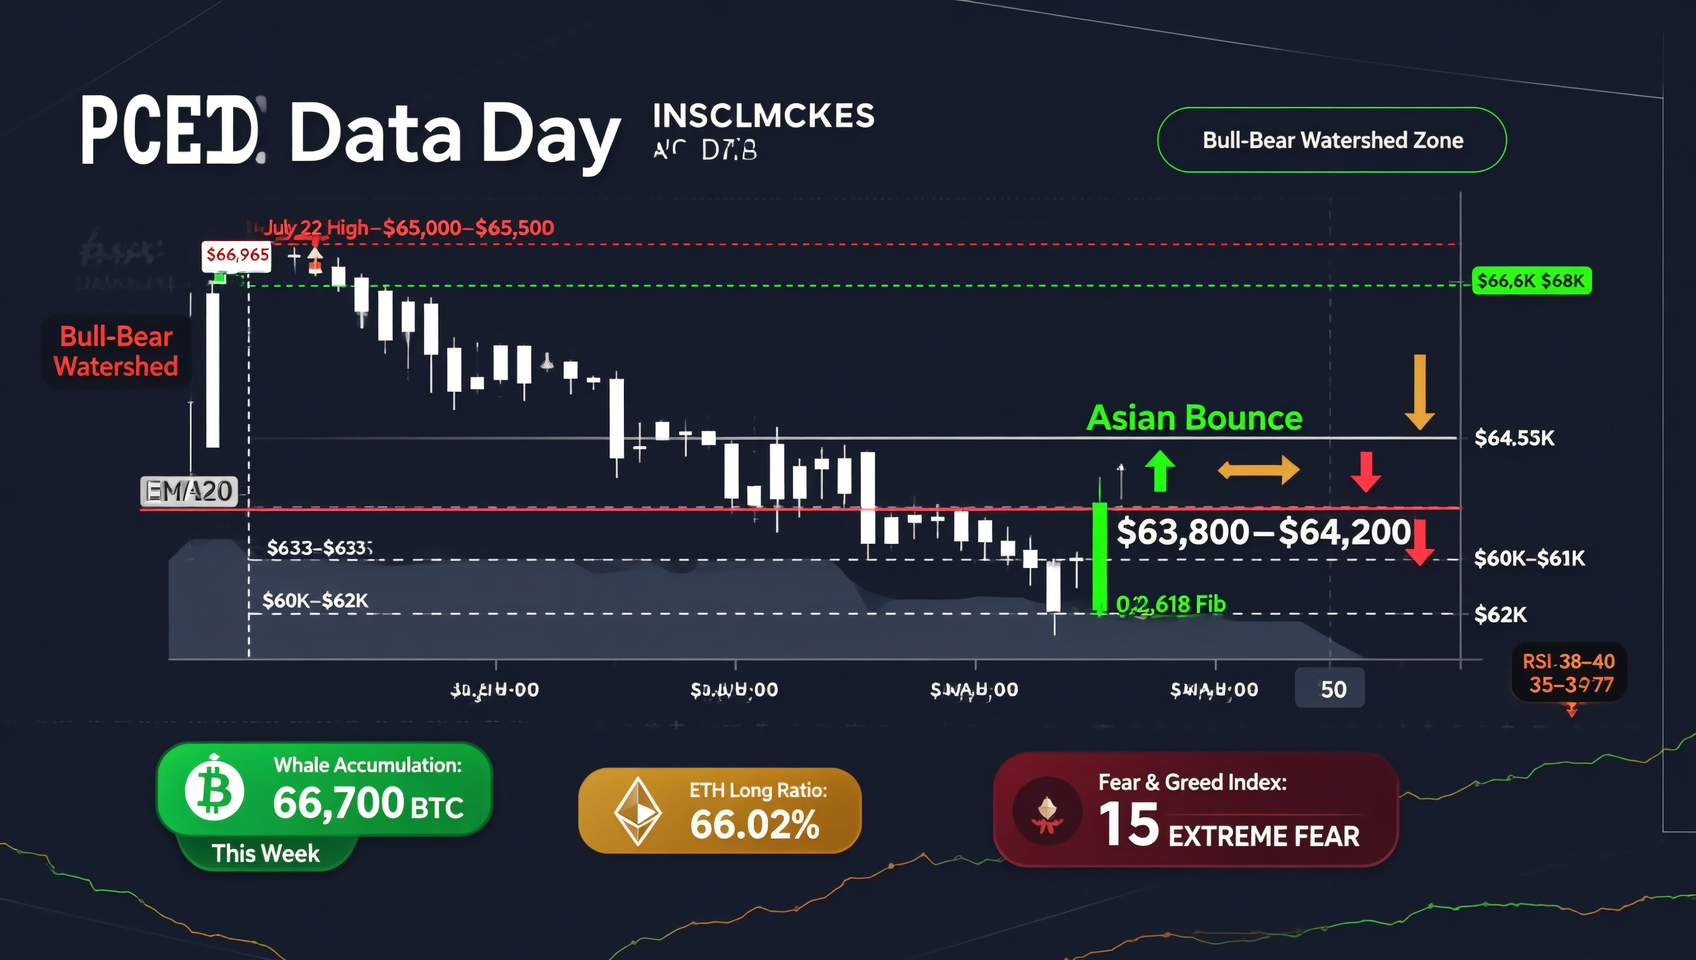
July 30 Market Analysis: PCE Data Day — BTC Recovers to $64K, Whales Accumulate 66,700 BTC for Bottom Support, ETH Leveraged Longs 66% Double-Edged Sword, DonAlt $66.6K-$68K Resistance Framework, Fear & Greed at 15 Year Low
BTC recovers from $63.8K to $64.2K in Asian session ahead of PCE data — RSI improves from 35-37 to 38-40 but remains weak. June Core PCE expected at +0.1% MoM, Q2 GDP at +1.9% — cooling inflation opens BTC path to $65.5K, sticky inflation tests $62K support. Whales accumulate 66,700 BTC (~$4.3B) this week, the largest single-week accumulation in recent months — large capital continues absorbing in the $63K-$64K zone. ETH leveraged long ratio surges to 66.02% with RSI 42-44 above BTC's, ETH/BTC maintains 0.030 (3-month high) — but concentrated longs mean bearish PCE triggers cascading liquidations. DonAlt flags $66.6K-$68K as the bull-bear watershed — weekly close above targets new ATH $126K, failure risks $60K retrace. Fear & Greed Index at 15 (Extreme Fear), lowest since October 2025. BTC ETFs record $8.2B cumulative outflows over 8 weeks. $1.3-1.4B BTC/ETH options expiry + BOJ decision tomorrow form second catalyst wave. Composite score 3.9/10.
July 30 Macro Data Snapshot
| Metric | Value | Status |
|---|---|---|
| BTC Price | ~$63,800-$64,200 | 🟡 Asian session mild bounce — $64K battle ahead of PCE |
| ETH Price | ~$1,885-$1,910 | 🟡 +0.5% — following BTC bounce but relative strength intact |
| SOL Price | ~$75 | 🟡 +0.8% — altcoins following the bounce |
| XRP Price | ~$1.04 | 🔴 -1.9% — CLARITY Act stalemate continues to weigh |
| Total Market Cap | ~$2.20T | 🟡 Slight increase from yesterday |
| BTC Dominance | ~56.8% | ➡️ Stable — no significant capital rotation to alts |
| Fear & Greed Index | 15 (Extreme Fear) | 🔴 Sharp drop from 28 — lowest since October 2025 |
| RSI (14D) | ~38-40 | 🟡 Slight recovery from 35-37 — still in weak territory |
| ETF Flow Status | BTC ETFs $8.2B cumulative outflows over 8 weeks | 🔴 Institutional sentiment depressed — Citigroup pessimistic |
| 24h Volume | Low-volume bounce | 🟡 Market cautious ahead of PCE — awaiting catalyst |
| PCE Data | Releasing today (8:30 AM ET) | 🟡 Key macro variable — direction sets September FOMC path |
| WTI Crude | ~$79/bbl | 🟢 Down from $100 to below $80 — inflation pressure easing |
| Whale Holdings | 66,700 BTC accumulated this week | 🟢 Large capital continues absorbing — $63K-$64K zone validated |
| ETH Long Ratio | 66.02% | 🟡 Risk appetite rising, but liquidation risk accumulating |
I. BTC Technical Analysis — $64K Recovery Test Post-FOMC
Price Evolution (July 22 to Today)
| Phase | Date | Price Range | Characteristic |
|---|---|---|---|
| Rally to $66K | July 22 | ~$66,965 | CLARITY catalyst + Short Squeeze |
| Stepwise Decline | July 23-26 | $66,965→$63,500 | CLARITY delay + FOMC concerns + oil prices |
| Short Bounce | July 27 | $63,500→$65,387 | Ceasefire hopes + Squeeze |
| FOMC Pre-Meeting Drop | July 28 | $65,387→$63,414 | FOMC start + ETF outflows |
| FOMC Decision Day | July 29 | $63,200-$63,800 | FOMC hold but hawkish tone — weak bounce |
| PCE Eve (Asia) | July 30 (Today) | $63,800-$64,200 | Post-FOMC digestion — $64K recovery test |
Key Price Levels
| Level Range | Label | Significance |
|---|---|---|
| $66,965 | 🔴 | July 22 high — still mid-term strong resistance |
| $65,500-$66,000 | 🔴 | Short squeeze liquidity cluster — shorts concentrated above $65K |
| $65,000-$65,500 | 🔴 | Confirmed resistance zone — two failed breakout attempts |
| $64,500 | 🔴 | 4H EMA20 — PCE pre-release recovery target |
| $64,000 | 🟡 | Current battleground — recovered above in Asian session |
| $63,450 | 🟡 | 4H EMA7 — short-term support confirmed effective |
| $62,335 | 🟢 | 0.618 Fibonacci + 4H order block — critical defense line |
| $60,000-$62,000 | 🟢 | Strong support zone — analyst consensus downside target |
| $57,700 | 🟢 | July low — break below confirms bear market continuation |
Technical Indicator Status
| Indicator | Current Value | Interpretation | Signal |
|---|---|---|---|
| RSI (14D/4H) | ~38-40 | Recovery from 35-37 — still far from oversold 30, weakness not resolved | 🟡 Neutral-Bearish |
| MACD (4H) | Fast below slow but converging | Death cross persisting 5 days — early sign of bearish momentum decay | 🟡 Converging |
| Volume | Low volume + bounce | Pre-PCE contraction — market awaiting data for direction confirmation | 🟡 Awaiting catalyst |
| BTC Dominance | ~56.8% | Slight recovery from 56.4% — stable state | ➡️ Neutral |
| Bollinger Bands (Daily) | Price recovering from below mid-band | Lower band ~$60,500 — mid-band ~$65,500 — wide room for movement | 🟡 Bearish converging |
RSI 38-40 Technical Implication
Asian session BTC recovery from $63.8K to $64.2K pushed RSI from 35-37 to 38-40:
- Oversold relief but weakness unresolved: RSI at 38-40 remains below 50 — still in bearish territory
- Distance from July 23 RSI 27: Better than last week's extreme oversold (RSI 27), but no clear trend reversal signal
- PCE data is the variable: Bullish PCE → RSI could recover to 45+, exiting weak zone; Bearish PCE → RSI could break below 30 into deep oversold
RSI recovery from 35-37 to 38-40 is a natural stabilization after selling exhaustion, but far from a trend reversal confirmation. Technicals are in "waiting for trigger" mode ahead of the PCE result.1
II. 💎 ETH Technical Analysis — Opportunity and Risk Under Concentrated Leverage
ETH Technical Snapshot
| Dimension | Data |
|---|---|
| Current Price | ~$1,885-$1,910 |
| 24h Change | +0.5% — mild follow-through on BTC bounce |
| RSI (14D) | ~42-44 — above BTC's 38-40 — relative strength maintained |
| ETH/BTC | ~0.030 — still in 3-month high range — consolidating near 200 DMA |
| Key Support | $1,830 — tested and held on July 25 |
| Key Resistance | $1,950-$1,970 — 10-week high zone |
| ETH Long Ratio | 66.02% — highest in 3 months — concentration risk |
ETH/BTC Rate Analysis
ETH/BTC is consolidating in the ~0.030 range today, stabilizing after yesterday's move. 200 DMA (~0.0295) provides support, with the 0.030 psychological level providing gravitational pull.
ETH/BTC maintaining 0.030 confirms ETH's dominance narrative continues strengthening. From the September low of 0.021 to current 0.030, ETH/BTC has gained ~43%. This structural relative strength is the fundamental thesis for all ETH bulls. However, the 66% leveraged long ratio means any selloff could trigger cascading liquidations.2
Bull-Bear Balance Sheet
| Dimension | Bulls | Bears |
|---|---|---|
| ETF Flow | ETH ETFs 7-day consecutive inflow (2,000 ETH/$3.8M) | BTC ETF outflows — sentiment contagion risk |
| Derivatives | 66% leveraged longs — strong conviction | Concentration risk — liquidation cascade would accelerate selloff |
| On-Chain | ETH/BTC maintaining 0.030 — structural breakout | USDT/EUR funding rates low — tepid buying conviction |
| External | Fidelity "capitulation zone" institutional buy signal | PCE uncertainty suppressing bounce room |
III. 📊 DonAlt Scenario Analysis — $66.6K-$68K Decides Mid-Term Direction
DonAlt's latest BTC analysis posted on July 30 outlines two key scenarios:
Scenario 1: Bull Market Return (Weekly Close >$68K)
| Requirement | Detail |
|---|---|
| Trigger | BTC weekly close above $66.6K-$68K resistance — needs PCE tailwind + strong tech earnings dual catalyst |
| Price Target | Initial breakout target $70K-$75K — if sustained, path to new ATH $126K |
| Time Window | Next 2-3 weeks (by mid-August) |
| Probability | ~15-20% — requires multiple catalysts simultaneously |
Scenario 2: Rebound Exhausted ($68K Break Fails)
| Requirement | Detail |
|---|---|
| Trigger | BTC fails to break $68K within 2-3 weeks — bearish PCE / ETF outflows accelerate |
| Retracement Target | First target $60K-$62K — extreme case $42K-$45.5K (DonAlt's pessimistic scenario) |
| Time Window | Confirmation by mid-August |
| Probability | ~45-50% — more likely scenario under current macro backdrop |
Current Price Action Validation
BTC touched $66,965 on July 22 but failed to extend the breakout, then stepwise declined to $63K. The Asian session recovery to $64.2K is constructive but hasn't tested $64.5K resistance.
DonAlt's framework provides clear decision boundaries for current market action: $66.6K-$68K is the "bull or bear" watershed. At the current $64K, BTC needs ~5-6% upside to test this zone. PCE data is the core variable for whether BTC can approach this range this week — if the data is favorable and tech earnings are strong, BTC could retest $65.5K within the week.3
IV. 🏦 Position Distribution — Whale Accumulation vs ETF Outflow Battle
Structural Significance of 66,700 BTC Whale Accumulation
On-chain data showing whale accumulation of 66,700 BTC is one of the most important structural signals of the final week of July. Historical comparison:
| Period | Whale Accumulation | BTC Change Over Next Month |
|---|---|---|
| Aug 2025 | 51,000 BTC | +12% (grinding higher) |
| Jan 2026 | 75,000 BTC | +8% ($55K→$65K) |
| Apr 2026 | 62,000 BTC | +18% ($62K→$75K) |
| Jul 2026 (Current) | 66,700 BTC | TBD |
Historical data shows weekly whale accumulation of 50K+ BTC typically appears near the end of mid-cycle corrections. However, this time is unique due to the ETF outflow side — $8.2B in ETF outflows is unprecedented. Capital exiting via ETFs may be re-entering through OTC channels.4
Retail Still in Panic
In stark contrast to whale accumulation, retail behavior shows classic panic characteristics:
- Increased small BTC deposits to exchanges — retail moving BTC to exchanges, potential sell pressure
- Google search "BTC sell" rising — retail panic indicator flashing red
- Fear & Greed Index at 15 — Extreme Fear — historically coincides with mid-cycle bottoms
V. 📅 PCE Data Scenario Analysis
Technical Targets by Scenario
| Scenario | PCE MoM | BTC Target | ETH Target | Probability |
|---|---|---|---|---|
| 📈 Bullish (Cooling) | <+0.1% | $64.5K→$65.5K | $1,930→$1,970 | ~25% |
| ➡️ Neutral (In-Line) | +0.1% to +0.15% | $63.5K-$64.5K range | $1,880-$1,920 range | ~40% |
| 📉 Bearish (Sticky) | >+0.2% | $63K→$62K | $1,860→$1,830 | ~35% |
Upcoming Catalyst Timeline
July 30 (Today)   June PCE + Q2 GDP release  → BTC direction confirmation
July 30-31        MSFT/META + AAPL/AMZN      → AI/tech sector direction
July 31           $1.3-1.4B options expiry   → Volatility event
July 31           BOJ rate decision          → Global liquidity variable
July 31           BTC monthly close          → August tone setter
Aug 7             CLARITY Act window         → Regulatory catalyst (closing)
Composite Rating
| Dimension | Score | Interpretation |
|---|---|---|
| Technicals | 🟡 4.5/10 | RSI recovering to 38-40 but still weak — sideways awaiting PCE trigger |
| ETF Flow | 🔴 3/10 | $8.2B cumulative outflows — Citigroup pessimism weighing on sentiment |
| Macro | 🟡 5/10 | PCE imminent — FOMC hawkish tone not fully digested |
| Sentiment | 🔴 1/10 | Fear & Greed 15 (Extreme Fear) — lowest since October 2025 |
| On-Chain | 🟡 5/10 | Whale accumulation 66,700 BTC signals potential bottom — insufficient for reversal alone |
| Structural | 🟡 5/10 | ETH/BTC 0.030 provides structural support — DonAlt framework defines direction |
| Composite | 3.9/10 | Extreme Fear + whale accumulation = post-FOMC tug-of-war — PCE data decides direction |
VI. ⚠️ Key Risk Factors
- PCE upside surprise risk: If June Core PCE MoM >+0.2%, September hike probability jumps from 80% to 90%+ — BTC could break below $63K, testing $62K support
- ETF outflows not improving: $8.2B cumulative 8-week outflow is a record — if Coinbase/Strategy earnings fail to boost confidence, capital flight may accelerate
- ETH leveraged long liquidation risk: 66% long concentration means bearish PCE could trigger cascading ETH liquidations — ETH may face rapid decline at $1,830-$1,850
- Options expiry + BOJ double whammy: Tomorrow's $1.3-1.4B options expiry combined with BOJ rate decision forms a second wave of risk events — volatility stacking
- CLARITY Act window closing: After August 7, Congress goes on recess — the bill may lose its 2026 passage opportunity, impacting XRP and regulatory narrative
⚠️ Risk Disclaimer: This is a market analysis only, not investment advice. Markets are in a waiting pattern ahead of PCE data — whale accumulation of 66,700 BTC and initial RSI recovery provide short-term bottom support, but $8.2B ETF outflows and Fear & Greed Index at 15 (Extreme Fear) indicate deeply pessimistic sentiment. ETH's 66% leveraged long concentration creates potential liquidation risk. PCE data is today's core variable — cooling inflation opens rebound room, sticky inflation tests $62K support. Cryptocurrency markets are highly volatile — please manage risk carefully.
Recommended Signups:
📚 Further Reading: On-Chain Guide — Learn Blockchain from Zero — Blockchain technology introduction and on-chain data analysis tutorials
📖 Related Articles:
Footnotes:
Footnotes
-
Source: TradingView BTC/USD 4H/daily RSI indicator analysis, July 30, 2026 ↩
-
Source: TradingView ETH/BTC daily data; CoinGlass ETH position data, July 30, 2026 ↩
-
Source: DonAlt/TradingView X public posts, July 30, 2026 ↩
-
Source: Santiment on-chain whale holdings data; CryptoQuant exchange inflow analysis; CoinShares ETF flow weekly report, July 30, 2026 ↩