
July 31 Market Analysis: BTC Holds $64K Monthly Close — PCE Cooling + Short Squeeze Rally, RSI Recovers to Neutral, Glassnode's Shallowest Bear Market (Spot Volume at 2019 Lows), August Seasonality Warning, BOJ + $9.6B Expiry Set Direction
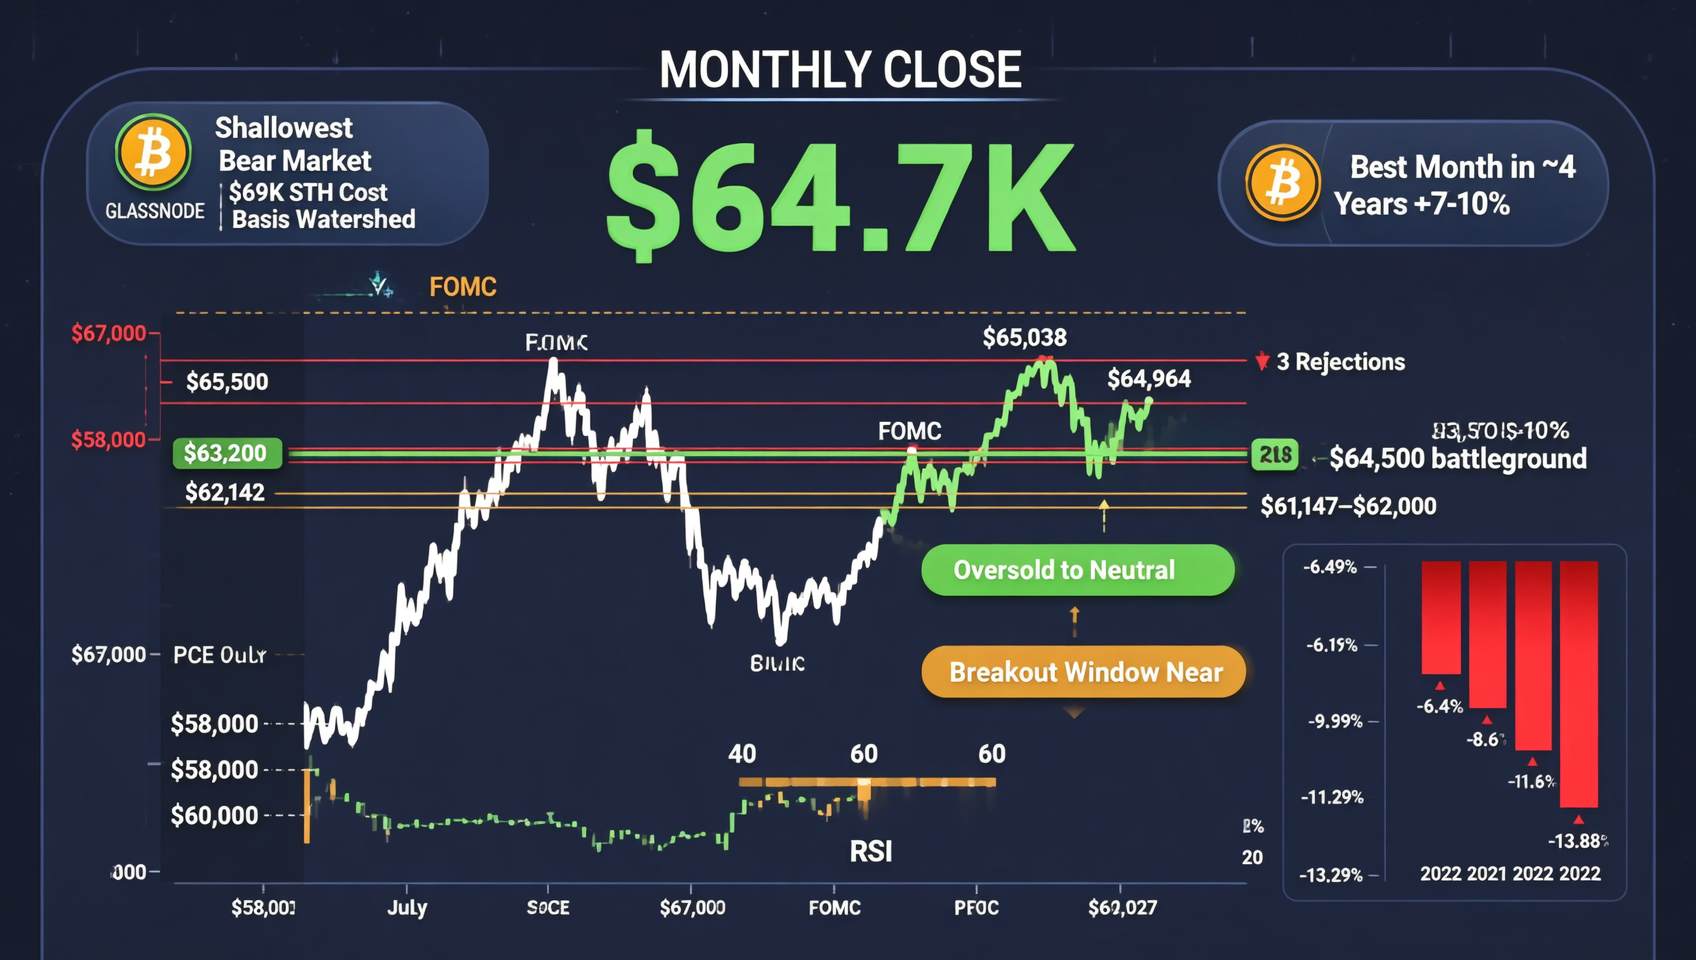
Bitcoin holds above $64K on the monthly close day, settling near $64.7K with a 7-10% July gain — the best month in nearly four years. PCE cooling (3.7% YoY, -0.1% MoM) and a short squeeze ($92.3M short liquidations, 62.67% of total) drove the bounce, but spot volume at 2019 lows and -15.48% derivatives volume show the rally is covering-driven, awaiting incremental capital. RSI recovered from oversold (<20) to the neutral 40-60 zone; $65K has rejected three attempts while $64,102 support has held twice. Glassnode calls it the "shallowest bear market": cost basis cluster $62K-$68K, the $69K STH cost basis is the watershed, and overhead supply sits at $83K-$86K. ETH trades $1,917-$1,925 (+1.89%). August seasonality (negative every August since 2022) plus analyst consensus imply a correction with a bottom in late Sep-Oct. Today's BOJ decision and $9.6B options expiry are the short-term volatility catalysts. Composite score 4.2/10.
July 31 Macro Data Overview
| Metric | Value | Status |
|---|---|---|
| BTC Price | ~$64,500-$64,900 | 🟢 Holds $64K on monthly close day — consolidating after $65K rejection |
| ETH Price | ~$1,917-$1,925 | 🟢 +1.89% — tracking BTC higher with relative strength |
| SOL Price | ~$75 | 🟢 +2.30% — alts broadly following the bounce |
| XRP Price | ~$1.08 | 🟢 +1.84% — but CLARITY Act setback continues to weigh |
| Total Market Cap | ~$2.21T | 🟢 Up vs prior day |
| BTC Dominance | ~56.6% | ➡️ Stable — no significant rotation to alts |
| Fear & Greed Index | 28 (Fear) | 🟢 Recovered 4 straight days from 15 (Extreme Fear) |
| RSI (14D) | ~40-60 neutral | 🟢 Recovered from oversold (<20) — near-term momentum improving |
| June PCE YoY | 3.7% (MoM -0.1%) | 🟢 First monthly decline since 2020 — inflation cooling |
| 24h Volume | ~$62.1B | 🟡 Spot volume up but derivatives -15.48% — short-covering driven |
| Liquidations | $147.2M (shorts $92.3M) | 🟡 Short squeeze — leverage cleaned out |
| BOJ Decision | Hold at 1.00% (today) | 🟡 Hawkish signal — volatility after FX intervention |
| Options Expiry | $9.6B monthly settlement (today) | 🟡 Gamma squeeze risk |
一、BTC Technical Analysis — $64K Monthly Close, $65K Rejected
July Price Journey
| Phase | Date | Range | Feature |
|---|---|---|---|
| July low | Early July | ~$58,000 | Bottom after June's 20% crash |
| Rally to $67K | Mid-July | ~$67,000 | Monthly high — AI + CLARITY optimism |
| FOMC pullback | Jul 28-29 | $67K→$63.2K | Hawkish hold + ETF outflows |
| PCE bounce | Jul 30 | $63,269→$64,964 | PCE cooling + short squeeze — touched $65,038 |
| Monthly close day | Jul 31 (today) | $64,500-$64,900 | Rejected at $65K — consolidating high |
Key Level Structure
| Level | Tag | Meaning |
|---|---|---|
| $67,000 | 🔴 | July high — medium-term strong resistance |
| $65,000-$65,500 | 🔴 | Confirmed resistance — $65,038 high not broken |
| $64,500 | 🟡 | Current battleground — monthly close anchor |
| $64,102 | 🟢 | Short-squeeze rally origin — key near-term support |
| $61,147-$62,000 | 🟢 | Cowen's dense order flow zone — secondary support |
| $60,000 | 🟢 | Widely-watched strong support — break opens $50K |
Technical Indicators
| Indicator | Value | Interpretation | Signal |
|---|---|---|---|
| RSI (14D) | ~40-60 | Recovered from oversold (<20) to neutral — momentum improved, trend unconfirmed | 🟢 Mildly bullish |
| MACD | Converging | Momentum repairing after bottom — direction awaits monthly close | 🟡 Watch |
| Bollinger Bands | Compressing | Breakout window approaching — the tighter, the stronger the eventual move | 🟡 Big direction choice |
| Volume | Spot up, derivatives down | Short covering + spot absorption — not trending accumulation | 🟡 Needs confirmation |
BTC has formed a "three failed attempts" resistance pattern at the $65K gate, while the $64,102 support has held twice. The compressing Bollinger Bands signal a major directional choice is near — whether the monthly close holds above $65K will be the first test of August's direction.1
二、💥 The Short Squeeze Structure — Quality of the Rally
Deep Dive into Liquidation Data
The rally's core engine is a short squeeze, whose data signature deserves an objective look:
| Dimension | Data | Meaning |
|---|---|---|
| Total Liquidations | $147.2M | Moderate scale — not an extreme move |
| Short Share | $92.3M (62.67%) | Shorts cleaned out — crowded positioning eased |
| Derivatives Volume | -15.48% QoQ | Insufficient new positioning — no leverage support |
| Spot Volume | Lowest since 2019 (Glassnode) | Spot market "silent" — real buying cautious |
The fundamental difference between a short squeeze and a trend reversal: the former is "shorts capitulating by covering," the latter requires "bulls actively buying incrementally." Current data shows a textbook squeeze — 62.67% of the $147.2M in liquidations were shorts, while spot volume sits at a 2019 low, meaning real buying hasn't entered at scale. Whether the rally continues depends on fresh money willing to chase above $65K.2
Two Paths After the Squeeze
- Path A (continuation): Spot volume breaks $65,038 on expansion → opens the $66-67K test → challenges the July high
- Path B (exhaustion): Fails at $65K on shrinking volume → retests $64,102/$63.2K → a break risks $61-62K support
三、🔬 Glassnode's "Shallowest Bear Market" — Deep On-Chain Signals
Glassnode's latest weekly report frames the current structure as the "shallowest bear market," with several key data points:
| On-Chain Metric | Data | Interpretation |
|---|---|---|
| Spot Volume | Lowest since 2019 | Market "silence" — real participation at a freeze point |
| Cost Basis Cluster | $62K-$68K | Half STH + half LTH — densest turnover zone |
| STH Cost Basis | $69,000 | The watershed line for the next leg |
| Supply Wall Above | $83K-$86K | The real overhead supply |
| Options IV | Compressed at range bottom | Traders pricing "six months of extreme quiet" |
| Order Book | Bids stacked 2%-20% below spot | Buyers willing to enter, but not chase |
Glassnode paints a picture of "waiting for consensus": buyers keep absorbing below $64K, but nobody is willing to mark prices higher on their own; spot volume at a 2019 low means trend money remains on the sidelines. The $69K STH cost basis is the key sentiment watershed — above it, short-term holders are collectively profitable and sentiment flips quickly; below it, fresh stop-loss selling pressure releases.3
四、💎 ETH & Alts — Relatively Strong Followers
ETH Technicals
| Dimension | Data |
|---|---|
| Price | ~$1,917-$1,925 (+1.89%) |
| RSI | Above BTC's — stronger bounce elasticity |
| ETH/BTC | Maintains relative strength — alt leadership structure intact |
| Liquidations | ~$25.66M per-coin — both longs and shorts cleared |
Altcoin Performance
BNB led majors at +4.57%, with SOL +2.30%, XRP +1.84%, DOGE +1.33%. The alt bounce is broadly moderate with no independent trend — BTC dominance holding near 56.6% means capital hasn't systematically rotated to alts.
Altcoin gains match or slightly exceed BTC's, but with BTC dominance showing no meaningful decline, this reads as "beta following" rather than "alpha rotation." Watch $65K: if BTC holds on volume, alt elasticity activates; if BTC stalls, alts give back gains first.
五、📅 August Outlook — Historical Seasonality Is the Loudest Warning
Monthly Performance Review
BTC closes July at ~$64.7K, up ~7%-10% on the month — the best in nearly four years. But that backdrop is precisely where historical seasonality is most dangerous:
| Year | July | August |
|---|---|---|
| 2025 | Rally | -6.49% |
| 2024 | Rally | -8.60% |
| 2023 | Rally | -11.29% |
| 2022 | +17% | -13.88% |
Every August since 2022 has ended in a BTC monthly loss. The 2026 path closely mirrors 2022 — a strong July (+17%) followed by an August collapse (-13.88%). With both historical seasonality and analyst consensus warning, a defensive posture in August is more rational than an offensive one.
Analyst Views
| Analyst | August View | Key Levels |
|---|---|---|
| Benjamin Cowen | 2018 playbook — Aug/Sep give back July gains | Support $61,147; bottom late Sep-early Oct |
| Weiss (Villaverde) | Rally to ~$70K in early Aug then correction | Strong support $58K; low Sep-Oct |
| Noname (most bearish) | August begins the "true collapse" — tests $50K | W-bottom in Sep; true bottom Oct |
| Aralez | August rally to $65-68K is a "trap" | Bottom $46K (Oct); $100K by year-end |
A notable consensus: no analyst sees August as a breakout month. The mainstream view is at least one meaningful pullback in August, with a real bottom in late September-October. A minority view (Aralez) still sees $100K by year-end — Nov-Dec is widely considered the recovery window after the correction.4
Composite Score
| Dimension | Score | Rationale |
|---|---|---|
| Technicals | 🟡 5/10 | RSI neutral + Bollinger compression — direction pending |
| Macro Environment | 🟢 6/10 | PCE cooling + Sept hike odds at 59% — tightening urgency easing |
| Sentiment | 🟡 4/10 | Fear & Greed at 28 still fearful — but improving 4 days straight |
| On-Chain | 🟡 4/10 | Spot volume at 2019 low — "shallowest bear" characteristics |
| Capital Flows | 🔴 3/10 | Short-covering driven — no incremental buying — ETF flows not returning |
| Seasonality | 🔴 3/10 | Every August since 2022 negative — historical odds unfavorable |
| Composite | 4.2/10 | PCE cooling + squeeze rally improve near-term — but August seasonality + volume-less rally create medium-term pressure |
六、⚠️ Key Risks
- August seasonality: Every August since 2022 has been negative; July 2026's strong rally raises the risk of an August reversal
- Volume-less rally: 62.67% of the $147.2M in liquidations were short covering — without expanding spot volume, the $65K resistance holds
- BOJ hawkish risk: If Ueda's tone is hawkish and the yen strengthens, carry-trade unwinds hit global risk assets
- $9.6B options Gamma squeeze: Settlement-day volatility may amplify directional moves — two-way risk
- CLARITY Act shelved: The Senate has set it aside until the August recess — XRP and regulatory narrative under near-term pressure
⚠️ Risk Disclaimer: This is a deep market analysis, not investment advice. PCE cooling and the short squeeze pushed BTC to $64.7K, with the monthly close holding above $64K — but the rally is short-covering driven with spot volume at 2019 lows, awaiting incremental capital to confirm its quality. August seasonality (negative every year since 2022) plus three failed attempts at $65K constitute medium-term pressure. Today's BOJ decision and $9.6B options expiry are the near-term volatility catalysts. Crypto markets are extremely volatile — please manage your risk.
Recommended exchanges:
📚 Further reading: On-chain Guide - Learn Blockchain from Zero — blockchain tutorials and on-chain data analysis
📖 Related reading:
- July 30, 2026 Crypto Market Deep Analysis
- July 30, 2026 Crypto News Deep Review
- July 29, 2026 Crypto Market Deep Analysis
Footnotes:
Footnotes
-
Source: TradingView BTC/USD daily/4H technical indicators; CoinGlass level data, July 31, 2026 ↩
-
Source: CoinGlass liquidation data; Glassnode spot volume indicator, July 31, 2026 ↩
-
Source: Glassnode on-chain weekly report (spot volume/cost basis/options IV), July 31, 2026 ↩
-
Source: CoinGlass historical monthly data; Benjamin Cowen/Weiss Ratings analyst views, July 31, 2026 ↩