
July 28 Market Analysis: FOMC Day 1 — BTC Retreats to $63K, $65K Fakeout Confirmed, $62K Support Tested, Three FOMC Scenarios
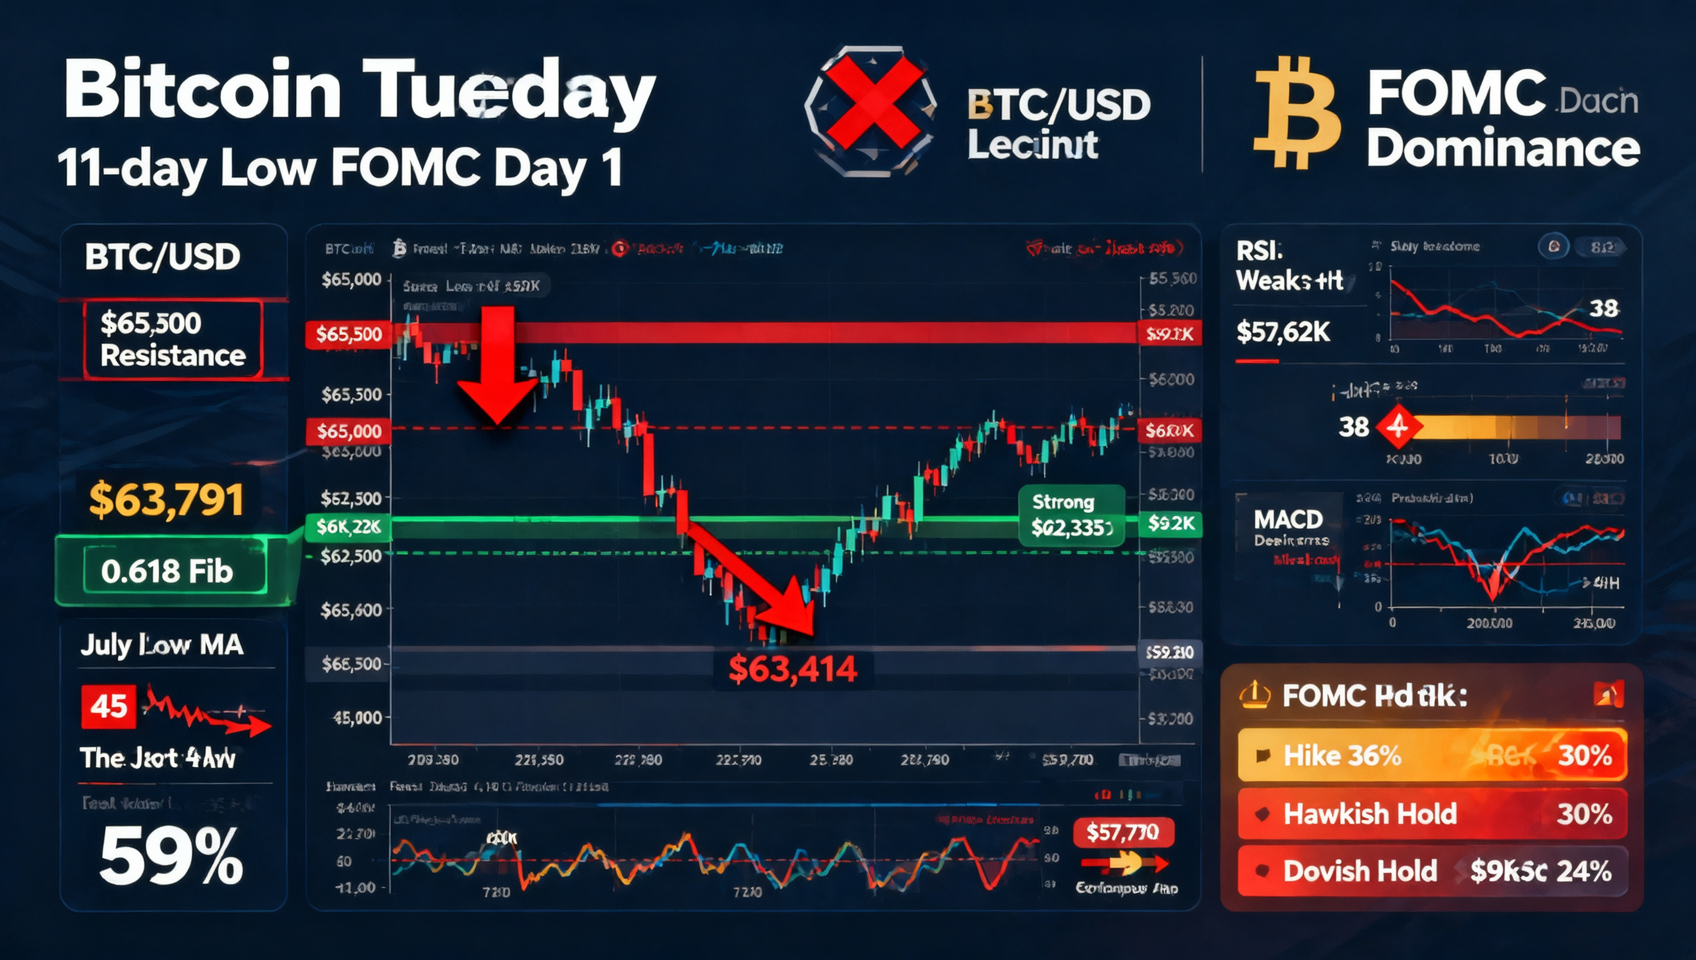
BTC dropped from above $65K to $63,414 (-2.3%) on FOMC Day 1, hitting an 11-day low. Monday's $65K bounce is confirmed as a fakeout, reclassifying $65,000-$65,500 from support test back to strong resistance. RSI fell from 45 to 38 returning to the weak zone, with 4H MACD fast line recrossing below the slow line confirming bearish momentum. BTC dominance edges up to ~59% as capital partially flows back to BTC for safety. ETH/BTC breaks above the 200 DMA (first time since January 2026) as the biggest structural highlight. Key support at $62,335 (0.618 Fibonacci + order block) with $60K-$62K as the next defense zone. 24h liquidations exceed $300M with 65-70% longs. Retail inflows at $78B vs whale inflows at $39B (whales -44.3% from June peak). Three FOMC scenarios: hike ($62K-$63K), hawkish hold ($63K-$64.5K), dovish hold ($65K-$67K).
July 28 Macro Data Snapshot
| Metric | Value | Status |
|---|---|---|
| BTC Price | ~$63,414-$63,791 | 🔴 11-day low, -2.3% daily |
| ETH Price | ~$1,892 | 🔴 -3.6% — leads the decline |
| SOL Price | ~$74 | 🔴 -3.4% — follows ETH |
| XRP Price | ~$1.066 | 🔴 -4% — worst performer |
| Total Market Cap | ~$2.27T | 🔴 Down from yesterday |
| BTC Dominance | ~59% | ➡️ Slight recovery from 58.64% — capital returns to BTC for safety |
| Fear & Greed Index | 30 (Fear) | 🔴 Down from 39 — sentiment deteriorates |
| RSI (14) | ~38 | 🔴 Back to weak zone |
| ETF Status | Monday net outflow $225M | 🔴 Institutions don't confirm bounce |
| 24h Volume | Volume-down | 🔴 Selling on volume |
| Brent Crude | ~$88/bbl | 🟢 -8% — inflation expectations cool |
| NVIDIA | -5.17% | 🔴 AI rout drags crypto |
| ETH/BTC | Above 200 DMA | 🟡 First time since January — alt rotation signal |
一、BTC Technical Analysis — $65K Breakout Invalidated, Back to $63K Range
Price Evolution (July 22 to Present)
| Phase | Time | Price Range | Characteristics |
|---|---|---|---|
| Rally to $66K | July 22 | ~$66,965 | CLARITY Act + ETF inflows + Short squeeze |
| Stepwise Decline | July 23-26 | $66,965→$63,500 | CLARITY delay + FOMC anxiety + oil $100 |
| Short-term Bounce | July 27 | $63,500→$65,387 | Ceasefire-driven + short squeeze |
| FOMC Retreat | July 28 (Today) | $65,387→$63,414 | FOMC opens + ETF outflows + NVIDIA crash |
$65K Fakeout: Technical Conclusion
Monday's $65K rebound has been confirmed as a fakeout:
- Breakdown within 24 hours — $65,387 lasted less than a day before being rejected
- ETF validation failed — $225M outflow during the bounce itself
- Volume divergence — Bounce volume was only 60% of prior selloff volumes
- RSI rejected at 45 — Fell back to 38, confirming insufficient momentum
In technical analysis, the $65K fakeout reclassifies $65,000-$65,500 from "support test" to "strong resistance." The next breakout above $65K will require a stronger catalyst (dovish FOMC) and genuine buying (ETF net inflows).1
Current Key Levels
| Level | Label | Significance |
|---|---|---|
| $65,000-$65,500 | 🔴 | Confirmed strong resistance — fakeout increases resistance strength |
| $64,500 | 🔴 | 4H EMA20 — lost after brief hold |
| $63,791 | 🟡 | Current price — consolidating $63.5K-$64K |
| $62,335-$63,000 | 🟢 | 0.618 Fib + 4H order block — critical support zone |
| $60,000-$62,000 | 🟢 | Strong support band — analyst consensus downside target |
| $59,356-$62,492 | 🟢 | 200-week MA zone — bull-bear boundary |
| $57,700 | 🟢 | July 2026 low — break below confirms bear market continuation |
Technical Indicators
| Indicator | Current Value | Interpretation | Signal |
|---|---|---|---|
| RSI (14) | ~38 | Back to weak zone from 45 — bounce fully negated | 🔴 Bearish |
| MACD (4H) | Fast crossing below slow line | Monday's potential golden cross fails — downside momentum resumes | 🔴 Bearish |
| Volume | Down on volume | Selling accompanied by volume expansion — different from yesterday's low-volume bounce | 🔴 Confirmed bearish |
| BTC dominance | ~59% | Slight increase from 58.64% — capital flows back to BTC from altcoins | 🟡 Mild risk-off |
| Bollinger Bands (4H) | Price near lower band | Lower band at ~$62,800 — band expansion likely if broken | 🔴 Bearish |
RSI 38 — What It Means
RSI dropping from 45 to 38 reveals:
- Bounce fully reversed — 45→38 returns to the weak zone, confirming the Monday rally was unsustainable
- Back to July 24 levels — Comparable to RSI 27→40 recovery pre-July 24 levels
- Not yet oversold — 38 leaves 8 points before the 30 oversold line; bears aren't exhausted
- FOMC risk not priced in — Current RSI of 38 doesn't reflect the scenario where FOMC delivers a hike (which could push RSI below 30)
RSI returning to 38 confirms the short-term trend has shifted back to bearish. BTC needs to hold $62,335 (0.618 Fibonacci) to prevent RSI from breaking below 30 into deep oversold territory.2
4H Consolidation Pattern
BTC is forming a tight consolidation range at $63,500-$64,000 (4H):
- Upper resistance: $64,000 psychological barrier + 4H EMA20 ($64,500)
- Lower support: $63,000-$63,500 (Monday's rebound origin + Asia session low)
- Pattern nature: Textbook "directional waiting" before FOMC — volatility compression typically resolves with a directional breakout
二、💎 ETH Technical Analysis — $1,892 Leads Decline but Holds Key Support
ETH Technicals
| Dimension | Data |
|---|---|
| Current Price | ~$1,892 |
| 24h Change | -3.6% — leads the market decline |
| RSI (14) | ~42 — above BTC's 38, showing less downside momentum |
| ETH/BTC | Above 200 DMA — first time since January 2026 |
| Key Support | $1,830-$1,850 — tested and held on July 25 |
| Key Resistance | $1,950-$1,970 — 10-week high range |
| July Gain | +24% — far above BTC's +10% |
Four Signs of ETH's Relative Strength
Despite dropping more than BTC (-3.6% vs -2.3%) on July 28:
- RSI 42 > BTC's RSI 38 — ETH's momentum is less damaged
- July gain +24% — structural advantage over BTC's +10%
- ETH/BTC above 200 DMA — technically bullish for ETH relative to BTC
- ETF weekly inflow $103.9M > BTC ETF — institutional preference shifting
Takeaway: ETH's steeper decline is primarily due to its higher beta, not fundamental deterioration. Under a dovish FOMC scenario, ETH remains one of the highest-upside rebound plays.3
ETH/BTC Above 200 DMA — Historical Significance
ETH/BTC breaking above its 200-day moving average for the first time since January 2026 carries historical weight:
- June 2023: ETH/BTC broke above 200 DMA → ETH outperformed BTC by 35% over 3 months
- November 2024: ETH/BTC broke above 200 DMA → 4-month altcoin rotation followed
- September 2025: ETH/BTC broke below 200 DMA → ETH weak for 8 months
- July 2026: Above 200 DMA again → Historically signals a new period of ETH relative strength
三、📊 Multi-Dimensional Market Assessment
| Dimension | Score | Assessment |
|---|---|---|
| Technical | 🟡 4/10 | BTC fakeout at $65K, RSI 38 weak zone, $62K test likely |
| ETF Flows | 🔴 3/10 | Monday $225M outflow, IBIT 89% of outflows |
| Macro Variables | 🟡 5/10 | FOMC 36% hike probability overhangs, oil -8% positive offset, PCE ahead |
| Market Sentiment | 🔴 3/10 | Fear & Greed 30 (Fear), cautious positioning pre-FOMC |
| On-Chain Data | 🟡 5/10 | Retail inflows $78B vs whale $39B — whales -44.3% from June peak |
| Structural Narrative | 🟢 7/10 | ETH/BTC 200 DMA breakout, S&P index inclusion, institutional tokenization |
| Composite Score | 4.3/10 | Bearish-leaning — cautious ahead of FOMC — awaiting tomorrow's direction |
四、🏦 Position Distribution — Retail Dominates, Whales Retreat
Binance BTC Flow Distribution (CryptoQuant)
| Flow Type | Data | Interpretation |
|---|---|---|
| Retail Inflows | $78B | Retail still active — mostly FOMO buying |
| Whale Inflows | $39B | Only half of retail |
| Whale Inflow Change | -44.3% (vs June peak) | Smart money significantly reduces entry |
What This Distribution Means
- Retail is the primary buyer — Recent BTC buying power is retail-driven, lacking institutional backing
- Whales have been reducing since June peak — -44.3% decline suggests "smart money" did not add at $65K+
- FOMC outcome could trigger extremes:
- Hike → $62K support break → retail panic → acceleration to $60K
- Dovish hold → retail sentiment improves + whales return → BTC could quickly reclaim $65K
CryptoQuant analysis notes that retail inflows roughly double whale inflows, making the market vulnerable to "retail stampede"-style selloffs when support breaks.4
五、🏛️ FOMC Scenario Analysis — 3 Technical Paths for BTC
Scenario 1: 25bp Hike (~36% Probability) — Bearish
| Phase | Time | BTC Target | Trigger |
|---|---|---|---|
| Immediate Reaction | 30 min post-FOMC | $62,000-$62,500 | Black-swan style selloff |
| Secondary Test | Next day (July 30) US open | $60,000-$62,000 | ETF outflow acceleration + PCE miss |
| Monthly Close | July 31 | $58,000-$60,000 | July closes -8% to -10% |
Scenario 2: Hold + Hawkish Statement (~30% Probability) — Neutral-Bearish
| Phase | Time | BTC Target | Trigger |
|---|---|---|---|
| Initial Relief | 30 min post-FOMC | $64,500-$65,000 | No hike → short covering |
| Profit-taking | During Presser | $63,500-$64,000 | Warsh emphasizes "inflation risks remain, September hike possible" |
| PCE Waiting | July 30 | $63,000-$64,500 | PCE data determines next direction |
Scenario 3: Hold + Dovish Statement (~24% Probability) — Bullish
| Phase | Time | BTC Target | Trigger |
|---|---|---|---|
| Strong Breakout | 1 hour post-FOMC | $65,500-$66,000 | Dovish statement → ETH/BTC continues breakout → concentrated short squeeze |
| Short Squeeze | July 30 Asia | $66,000-$67,000 | ETF turns net positive + ETH/BTC trend confirmed |
| Resistance Challenge | July 31 monthly close | $66,965-$67,500 | Monthly candle closes high → structurally bullish |
💡 Key Takeaway: Regardless of scenario, $60,000-$62,000 is BTC's most important defense line. If this zone breaks, the next stops are $57,700 (July low) and potentially $52,000-$58,000 (Nansen's bearish base case).5
六、⚠️ Remaining Critical Events This Week
| Date | Event | Impact | BTC Direction |
|---|---|---|---|
| July 29 14:00 ET | 🔥🔥🔥 FOMC Rate Decision | ⭐⭐⭐⭐⭐ | See 3 scenarios above |
| July 29 14:30 ET | Warsh Press Conference | ⭐⭐⭐⭐ | Hawkish/dovish tone determines persistence |
| July 30 08:30 ET | June Core PCE | ⭐⭐⭐⭐⭐ | >expectation = bearish; < = bullish |
| July 30-31 | MSFT/META/AAPL/AMZN Earnings | ⭐⭐⭐⭐ | Tech → AI stocks → crypto linkage |
| July 31 | BTC Monthly Close | ⭐⭐⭐⭐ | Monthly candle sets August tone |
| July 31/Aug 1 | ~$13-14B Options Expiry | ⭐⭐⭐⭐ | Post-expiry volatility may compress or expand |
⚠️ Disclaimer: This analysis is for informational and educational purposes only and does not constitute financial advice. FOMC Day 1 sees BTC dropping to $63,414 (11-day low) with the $65K fakeout confirmed. The 36% hike probability weighs heavily — a hike could push BTC to $60K-$62K. Cryptocurrency markets are highly volatile. Always do your own research.
Recommended:
📚 Further Reading: On-Chain Guide — Blockchain from Scratch — Blockchain fundamentals and on-chain data analysis tutorials
📖 Related Articles:
Footnotes:
Footnotes
-
Source: TradingView BTC/USD 4H candlestick data; The Block "BTC price falls to $63K as FOMC begins", July 28, 2026 ↩
-
Source: TradingView BTC RSI(14) analysis; Cointelegraph "Bitcoin risks dropping to $62K if FOMC delivers hawkish surprise", July 28, 2026 ↩
-
Source: TradingView ETH/BTC daily data; CoinMarketCap; SoSoValue ETH ETF flow data, July 28, 2026 ↩
-
Source: CryptoQuant Binance BTC flow analysis, July 28, 2026 ↩
-
Source: CME FedWatch Tool; Nansen research (BTC bear base case $52K-$58K); Bloomberg economist survey, July 28, 2026 ↩