



TL;DR: The Bottom Line First
A liquidation heatmap is a liquidity map, not a prediction chart — it shows where forced liquidations would trigger, not where price will go.
The five facts that matter most:
- Liquidation = getting liquidated = forced close. Futures use leverage; when price moves against you far enough that your margin can't cover the loss, the exchange force-closes your position. That's liquidation1.
- The heatmap is a modeled estimate, not real liquidation flow. Its colors (purple → yellow) represent estimated liquidation volume from low to high, derived from open interest plus an assumed leverage distribution. Directionally useful, dollar-precise it is not1.
- Liquidation data is a result, not a signal. By the time "$19 billion liquidated" is in the news, most of the move is done — trading off liquidation headlines is trading off the rear-view mirror. The largest single-day liquidation on record happened in October 2025: roughly $19B in leveraged positions liquidated in 24 hours, over 1.6 million traders, about 90% of it longs2.
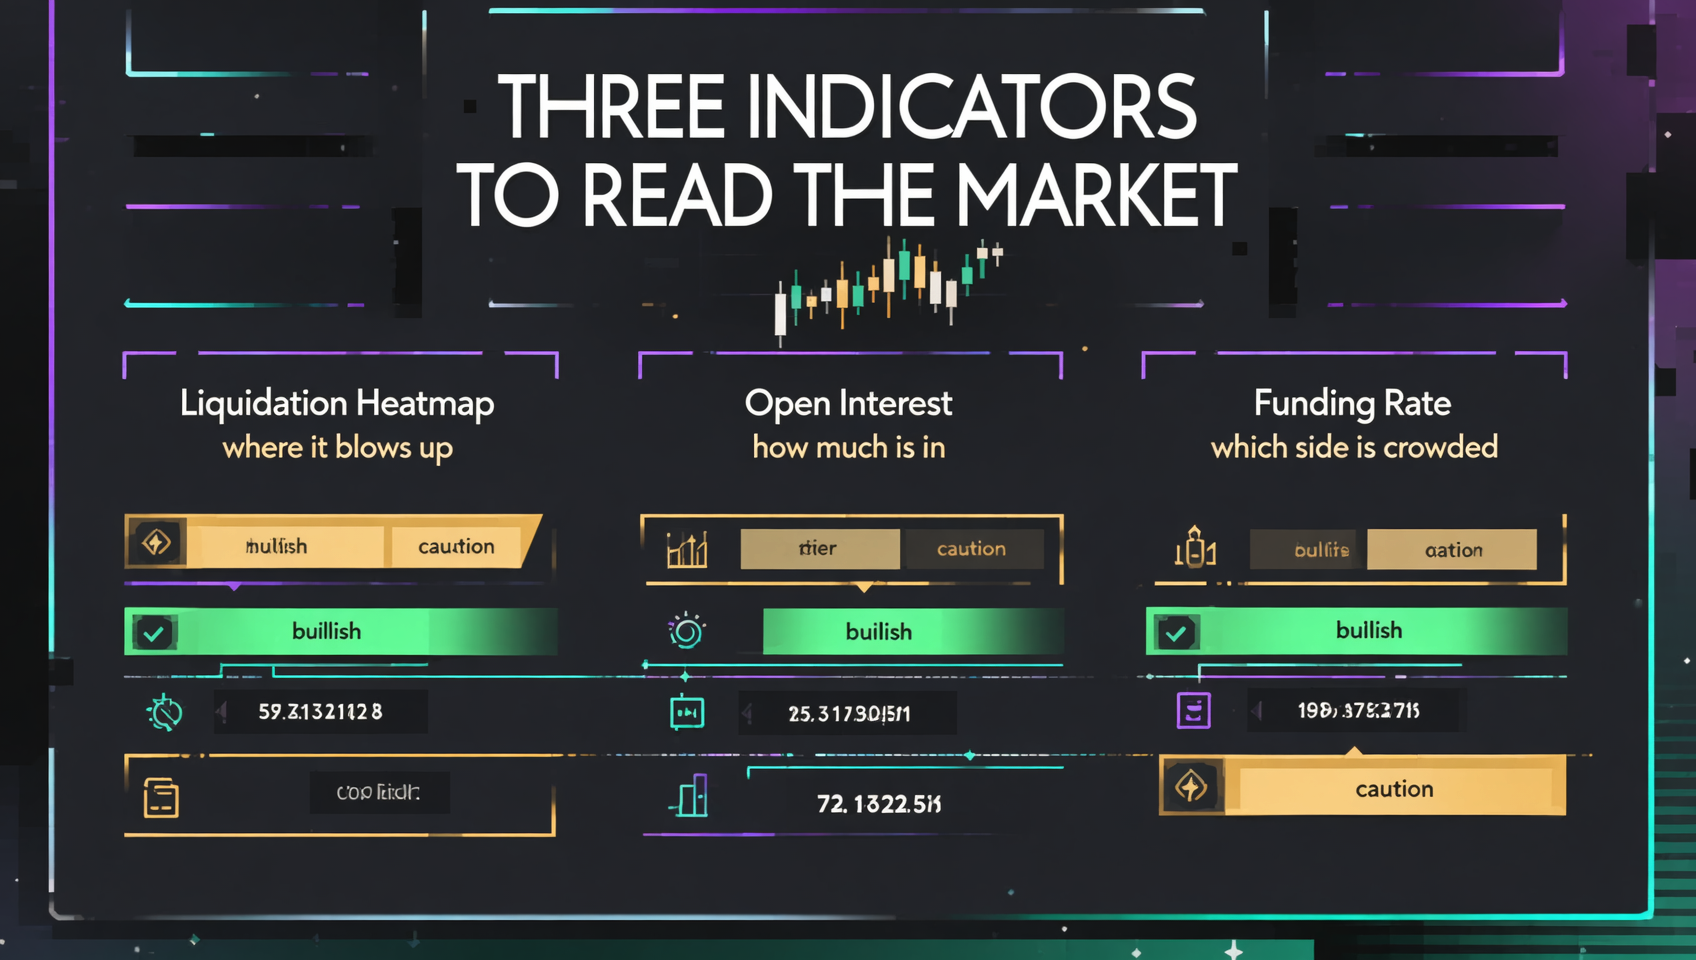
- What actually helps is the combination of three indicators: liquidation heatmap (where it blows up) + open interest (how much is still in) + funding rate (which side is crowded). Any one of them alone will mislead you.
- The beginner's takeaway: treat bright-yellow clusters as reference zones, not must-hit levels; use OI and funding rate to judge trend strength, not liquidation headlines to buy the dip or short.
If you're new to futures, understand how liquidation actually happens before you obsess over the chart. Let's start from the top.
Table of Contents
- First, what liquidation actually is
- What is a liquidation heatmap? How to read Coinglass
- Three core indicators: heatmap + open interest + funding rate
- How to combine them: a reusable framework
- 5 contrarian points beginners most need
- 3 common mistakes to avoid
- FAQ
- Further reading
First, what liquidation actually is
Before reading the chart, unpack the word "liquidation." It's not mysterious — it's the force-close mechanism of futures trading.
Futures = margin + leverage. You want to go long 1 BTC (price $100,000) but only put up $10,000; the platform lends you the other $90,000. That's 10x leverage. The $10,000 you put up is your margin.
Liquidation = price moves against you, margin runs out, the exchange force-closes you. When your position loses enough that the loss is about to eat your $10,000 margin, the platform stops waiting and force-closes your position, using the remaining margin to cover the loss. That action is liquidation — colloquially, "getting liquidated."
Two points beginners miss:
- Liquidation doesn't happen when you hit zero — it happens when margin is insufficient. At 10x leverage, a ~10% adverse move liquidates you; at 100x, just 1% does it.
- Liquidations cascade. Your forced close dumps your position at market, that selling pushes price further, which triggers the next batch of liquidations — a liquidation cascade. In extreme moves, this chain reaction multiplies volatility and is the usual mechanism behind flash crashes.
So the value of a liquidation heatmap comes down to one sentence: wherever leveraged positions are concentrated is a potential powder keg — once price reaches it, it detonates a wave of liquidations that in turn pushes price further.
What is a liquidation heatmap? How to read Coinglass
The liquidation heatmap is the signature chart of derivatives-data platforms like Coinglass, drawing those powder kegs in color.
How to read it
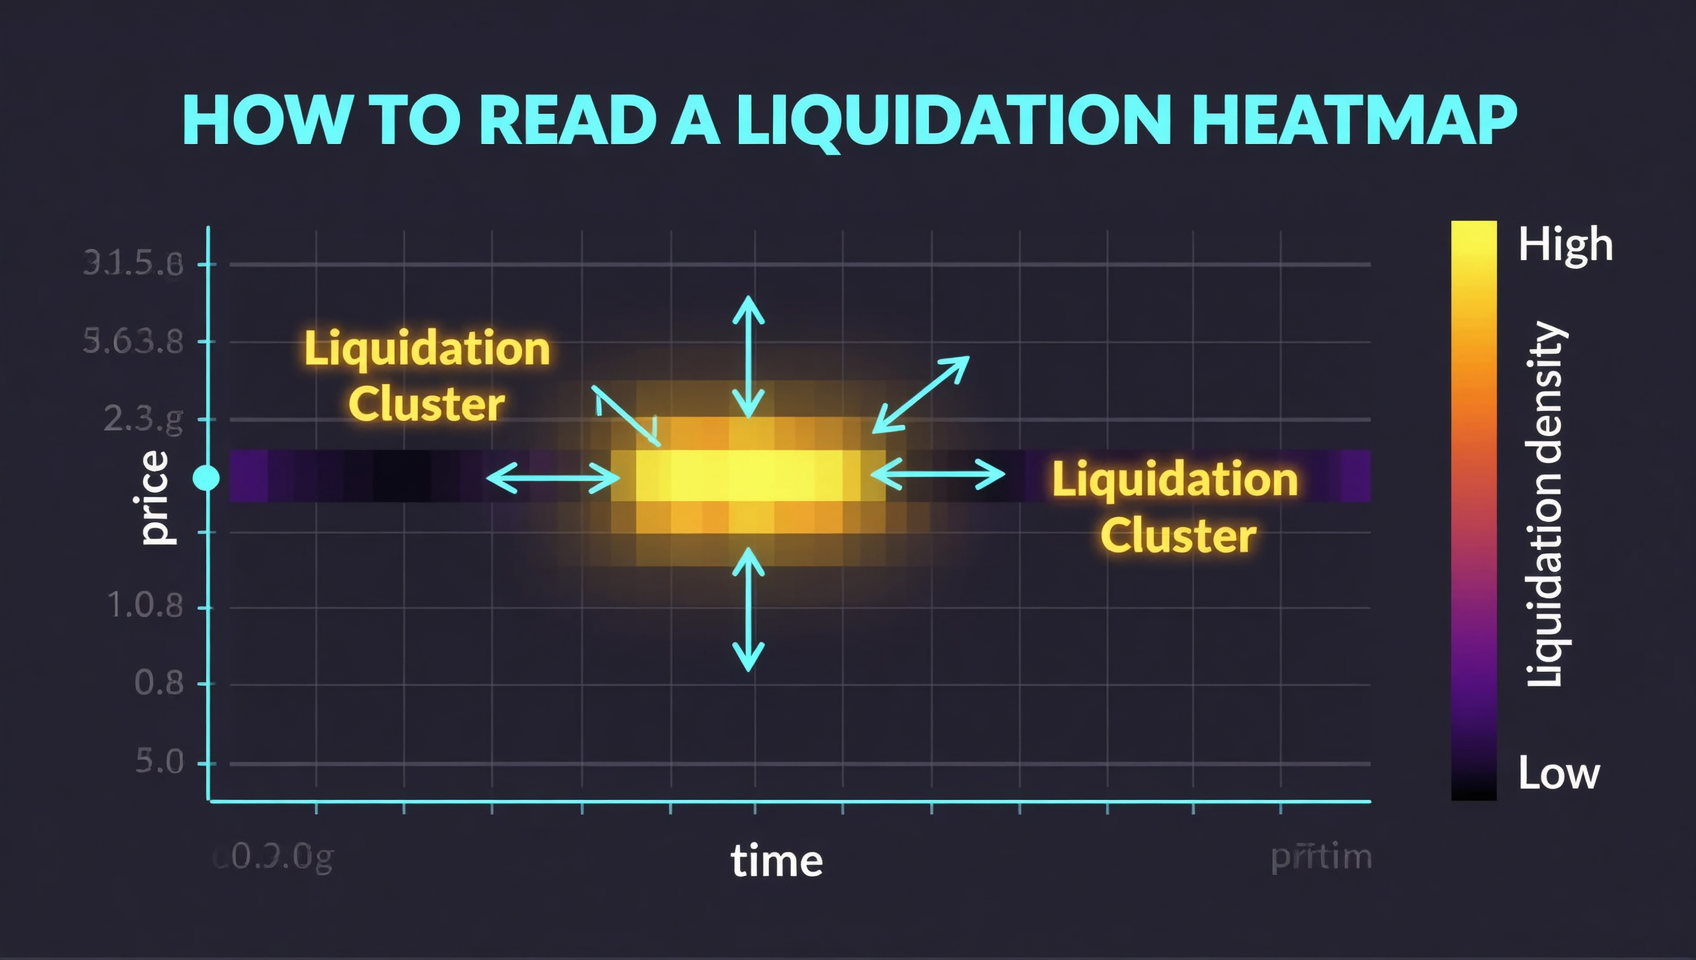
- Y axis is price, X axis is time (some views reverse this, using X for price).
- Colors run purple to yellow: purple = low estimated liquidation volume, bright yellow = high. The bright-yellow patches are the "liquidation clusters."
- Timeframes range from 12 hours up to 1 year. Short-term traders use 12–24h; longer-term use 7-day or 30-day.
Three concepts you must remember
It's a modeled estimate, not real liquidation flow. Exchanges don't publish "how many orders would liquidate at each level." Coinglass reverse-engineers it from public open interest plus an assumed leverage distribution. So it's directionally useful, but don't trust the exact numbers — actual liquidations are usually lower than shown1.
Magnet zones. When many liquidation orders cluster at a price, price tends to get "pulled" toward it — because there's liquidity there (orders to eat), and market makers and whales have an incentive to push price to that level and collect them. So a cluster is both support/resistance and a potential target.
It predicts where liquidations begin, not where they stop. The bright zone tells you "price reaching here detonates a wave," but the cascade's endpoint is not on the chart.
How to use it (the short version)
- Pick a timeframe (12–24h for short-term, 7–30d for structure);
- Find the brightest yellow zone — that's the cluster;
- Check whether price is approaching or moving away from it;
- Treat it as a reference zone, not an exact level;
- Always pair it with open interest and funding rate — never read it alone.
Three core indicators: heatmap + open interest + funding rate
The heatmap answers only one question: "where does it blow up." To judge the market, you need two more — open interest (OI) and funding rate. Together they form a complete "derivatives market sentiment" view.
| Indicator | What it answers | How to read it |
|---|---|---|
| Liquidation heatmap | Where it blows up, where clusters sit | Bright zones = clusters; use as reference/target |
| Open interest (OI) | How many positions are still open | Rising = new money in; falling = exits/liquidations |
| Funding rate | Which side is crowded | Positive = longs pay shorts (longs crowded); negative = shorts pay longs |
Open interest: a more honest "sustainability" metric than price
OI is the total number of open contracts. Price alone tells you "up or down"; OI tells you whether the move has fresh money behind it:
- Price up + OI up: new money is going long; the trend has fuel and is relatively healthy.
- Price up + OI down: the rise was driven by short covering / shorts getting liquidated, with no fresh longs behind it — prone to fading.
- Price flat + OI up: both sides are adding, disagreement is building — a drawn bow. Once one side gets liquidated, volatility spikes.
This is why liquidation news must be read with OI: if OI dropped sharply after the liquidations, leverage was cleared and the market "de-leveraged" — possibly a local bottom. If OI is still rising after liquidations, new people are piling into leverage and risk is still accumulating.
Funding rate: a thermometer for crowding, not a timer
Perpetual contracts have no expiry, so a funding rate mechanism keeps the perpetual price anchored to spot: positive funding means longs are paying shorts — more people are long, the side is crowded. Negative funding is the reverse.
It's a sentiment thermometer, but not a timing signal — positive funding can persist for a long time (longs pay throughout bull runs), and negative funding can too. Use it to gauge crowding: unusually high funding means long leverage is stacked and any bad news can trigger a cascade; funding turning negative with high OI often means shorts are over-crowded and a violent short squeeze becomes likely.
How to combine them: a reusable framework
Put the three together and you get a simple but practical framework. The core logic: price + OI = trend strength, funding rate = crowding, liquidation heatmap = the trigger point.
| Combined signal | What it means | Lean |
|---|---|---|
| Price up + OI up + funding mildly positive | Healthy uptrend, fresh money flowing in | Ride it; trim if funding gets extreme |
| Price up + OI down + funding turning positive | Rise driven by short covering, no fresh longs | Watch for a fade |
| Price flat + OI up + extreme funding | Intense long/short standoff, max disagreement | Volatility incoming; don't bet big on direction |
| Price down + OI sharply down + funding cooling | Leverage cleared, de-leveraging near done | Watch for stabilization |
| Price down + OI still rising | People still adding longs on the way down, risk not cleared | Don't rush to buy the dip |
| Price approaching a liquidation cluster | A liquidation wave is about to trigger | Wait for the direction after the trigger; don't load up before it |
A decision flow:
- First check OI vs price to see whether the trend has fresh money behind it;
- Then check funding rate to see which side is over-crowded;
- Then check the heatmap for the powder keg's price level — it can be support/resistance, or a target price gets pulled toward;
- Combine all three to decide: ride, trim, or wait for the trigger before acting.
5 contrarian points beginners most need
It's a liquidity map, not a prediction chart. Beginners most often treat it as a fortune-teller for "where price will go." Wrong — it shows "if price reaches here, how much liquidation triggers." Whether price actually gets there depends on capital, macro, sentiment, and more. The right use is "find the powder keg," not "predict the detonation time."
Liquidation data is a result, not a signal. "$X billion liquidated" already happened. Trading off that headline is driving by the rear-view mirror. What's actually forward-looking is where the liquidations clustered and whether OI followed through — not the scary dollar amount.
A liquidation cluster is both support/resistance and a magnet. Most people only use it as support/resistance. But there's liquidity there, and whales have an incentive to pull price toward it to eat those orders. So a cluster is both a place price may bounce/stall, and a place price may be deliberately pushed toward — think about both directions.
Open interest says more about sustainability than price. Raw price moves lie (they can be a few-minute wick), but OI changes don't — they reflect whether genuine new positions are entering. Judge trend health by OI first, then price.
Funding rate is a thermometer, not a timer. Very high funding means longs are crowded — but it can go higher still. Negative funding means shorts are crowded — and a squeeze can keep dragging. Use it to gauge crowding; using it to time entries ("funding's high, go short") usually gets you burned.
3 common mistakes to avoid
Don't buy the dip or short on liquidation dollar amounts alone. The difference between $100M and $1B liquidated is mostly "more people participated this time," not "it fell enough." To judge a bottom, watch whether OI cleared out and whether price held a key level — not the headline number.
Don't place orders at the heatmap as a precise level. It's a relative, modeled indicator; actual liquidations are usually lower than shown, and it only predicts where they begin, not where they end. Treat it as a zone, not a to-the-dollar order target.
Don't rely on the heatmap for altcoins. It's only reasonably reliable for high-liquidity coins like BTC and ETH; small-cap altcoins have sparse derivatives data and a single whale can distort the whole map1.
FAQ
What is a liquidation heatmap and where can I see it?
A liquidation heatmap is a visualization on platforms like Coinglass that uses color intensity to show the estimated distribution of forced liquidations by price. View it under Futures → Liquidation Heatmap, switching between coins and timeframes.
What do the colors mean?
Purple (low) to yellow (high) represents estimated liquidation volume from low to high; bright zones are liquidation clusters. These are modeled estimates, not actual exchange liquidation data.
Are liquidation and "getting liquidated" the same thing?
Yes. Liquidation is the official term for a force-close when margin can't cover losses; "getting liquidated" is the slang. Used interchangeably in futures.
Does a large liquidation amount mean buy the dip or short?
Not necessarily. It's a result, not a signal. What helps is where liquidations clustered plus OI and funding rate changes, not the isolated dollar amount.
What are open interest and funding rate?
Open interest is the total open contracts, representing how many positions are still open. Funding rate is a periodic payment between longs and shorts in perpetuals; positive means longs are crowded, negative means shorts are crowded.
Can I use the heatmap as precise support/resistance?
No. It's relative and modeled, actual liquidations are usually lower, and it only predicts where liquidations begin, not where they end. Treat it as a zone, and it's only reliable for BTC/ETH.
Further reading
- Binance Funding Rate: A Complete Guide — the funding rate indicator, explained in depth
- Binance Futures Leverage: How Much to Use — leverage and your liquidation price, before you open a trade
- Spot vs Futures: What Beginners Should Start With — if you haven't sorted out spot vs futures yet
- Crypto Trading Fees Explained: Maker vs Taker — know your costs before you trade
- DeFi Liquidation: How Lending Protocols Liquidate — a different kind of liquidation, don't mix them up
- On-chain Guide — more blockchain fundamentals and on-chain tutorials
Data verification: Liquidation heatmap mechanics and the October 2025 record liquidation event were verified on 2026-10-15; see footnotes12. Liquidation heatmap, open interest, and funding rate are live data — check Coinglass and each exchange for real-time values.
This article is not investment advice. Futures trading amplifies loss and liquidation risk, and crypto prices are highly volatile. Make decisions based on your own risk tolerance and comply with local laws and regulations.
Footnotes
-
Liquidation heatmap mechanics and limitations: Coinglass liquidation heatmaps are modeled estimates (reverse-engineered from open interest plus an assumed leverage distribution), not actual exchange liquidation flow; colors run purple (low) to yellow (high) for estimated liquidation volume; key concepts include magnet zones, support/resistance, and liquidation cascades; limitations include "predicts where liquidations begin, not where they end," "hedged positions double-count into OI and distort the picture," "a single whale can distort an entire map," and "data is unreliable for low-liquidity altcoins"; most reliable for high-liquidity coins like BTC and ETH. Source: Coinglass official learn page "How to use Liquidation Heatmaps to assist trading," Coinglass Liquidation Heatmap product page (queried Oct 2026). ↩ ↩2 ↩3 ↩4 ↩5
-
Largest single-day liquidation event: on 2025-10-10/11, after a US tariff announcement, roughly $19B–$19.5B in leveraged positions were liquidated across futures markets in 24 hours — the largest on record; longs accounted for about $16.7B (~90%, a ~6.7:1 ratio vs shorts) and shorts about $2.4–2.5B; over 1.6 million traders were liquidated; BTC fell from around $122k to $102–104k, and Hyperliquid alone recorded about $10.3B in liquidations. Source: Coinglass, The Kobeissi Letter, cross-confirmed by Advfn/BTCC/Bitget/Blockworks reporting (queried Oct 2026). ↩ ↩2