


TL;DR: The Bottom Line First
The Fear and Greed Index is an emotion gauge, not a trading signal — it tells you whether the market is panicking or euphoric right now, not whether tomorrow goes up or down.
The five most important facts:
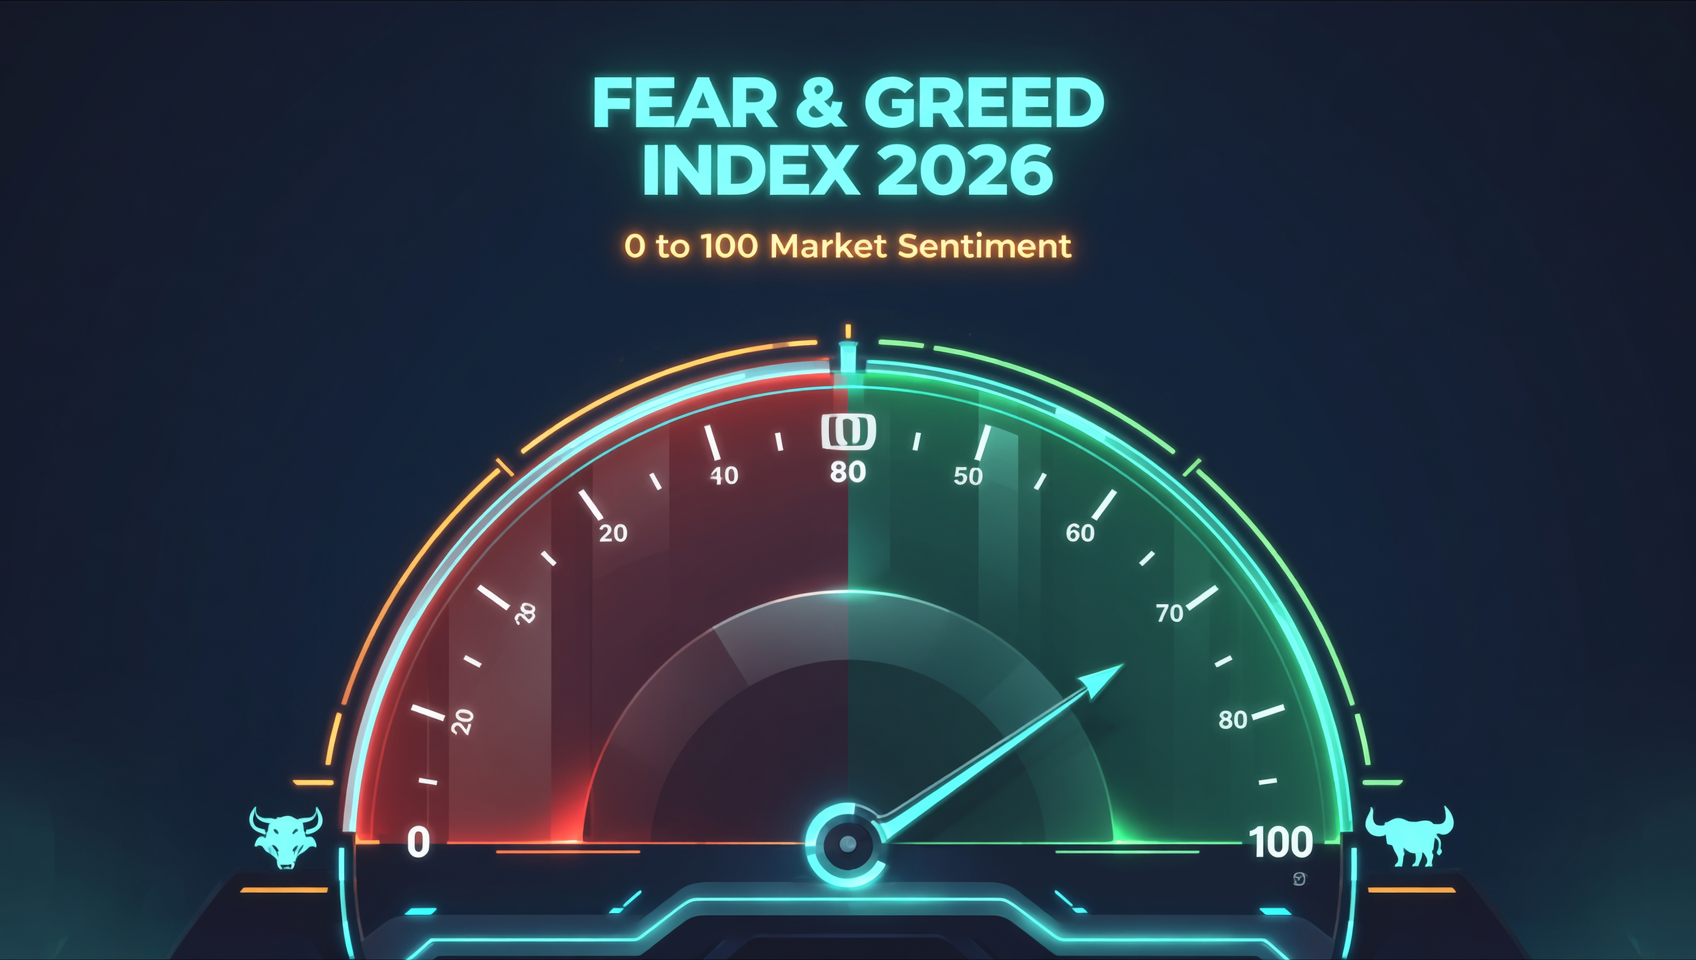
- It quantifies emotion on a 0–100 scale: 0–24 extreme fear, 25–49 fear, ~50 neutral, 51–74 greed, 75–100 extreme greed, updated daily by Alternative.me1.
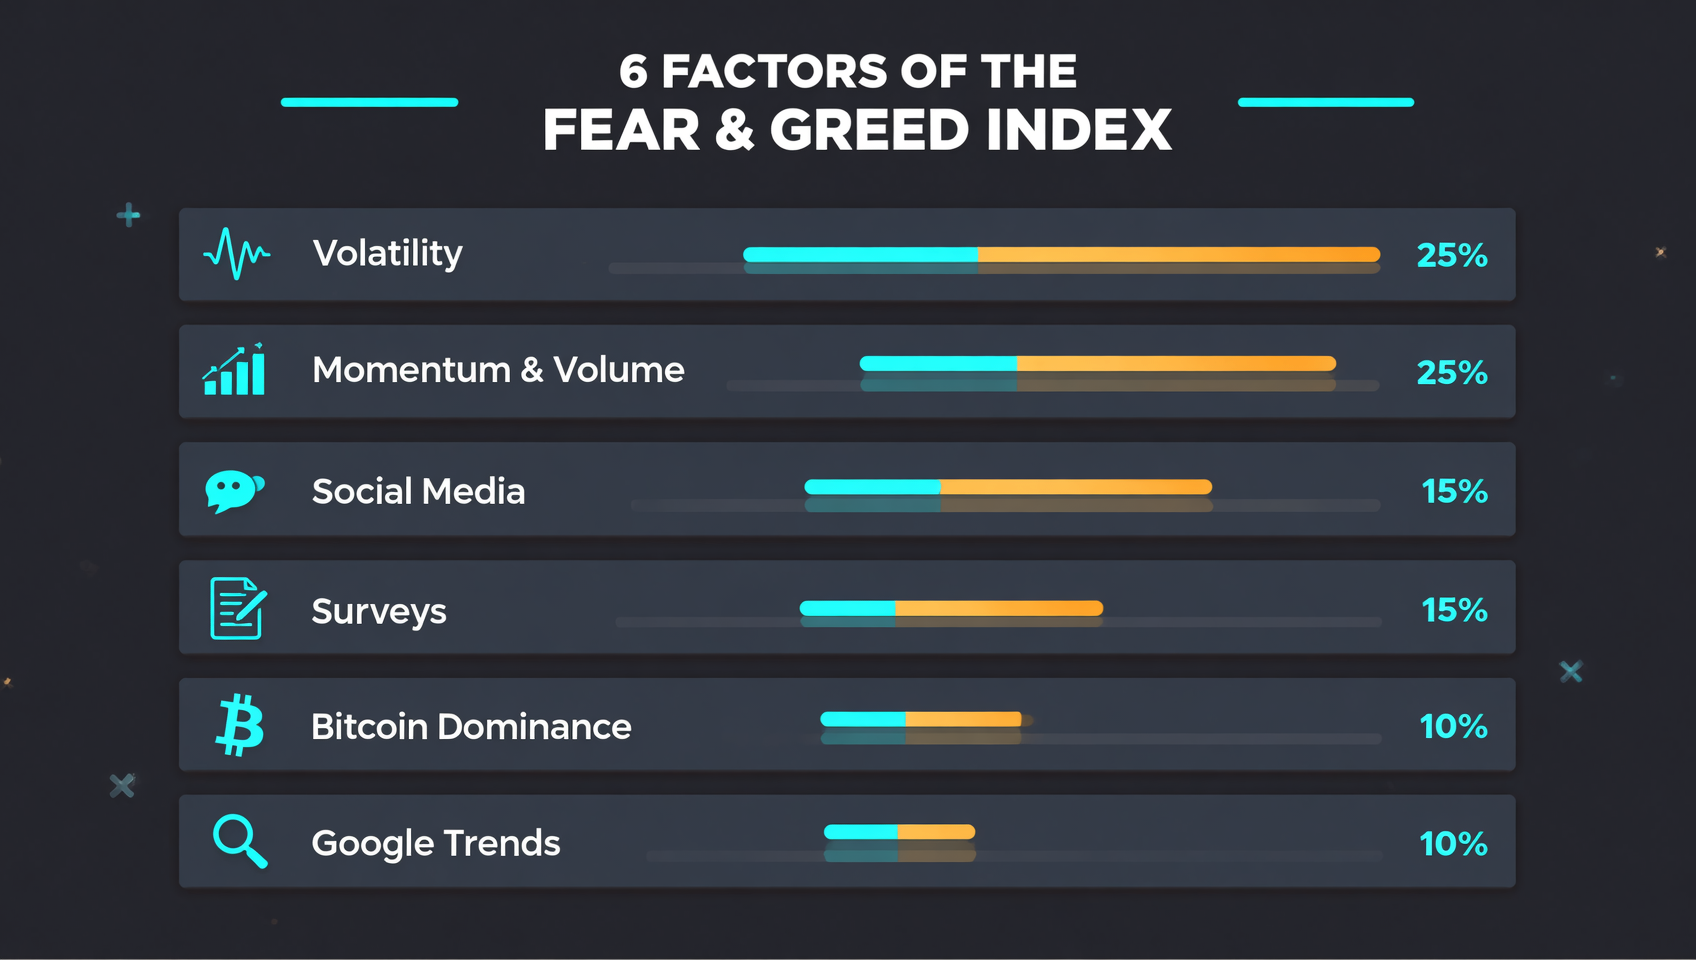
- It blends 6 weighted factors: volatility (25%), market momentum/volume (25%), social media (15%), surveys (15%, currently paused), Bitcoin dominance (10%), and Google Trends (10%)1.
- It's a contrarian indicator. Buffett's "be fearful when others are greedy, and greedy when others are fearful" is exactly how it's meant to be used — extreme fear tends to appear near local lows, extreme greed near rising risk2.
- But it barely predicts the next day: research shows the index matches the market's same-day direction about 79% of the time, but predicts the next day only about 49% of the time (near coin-flip odds). Its real value is flagging emotional extremes, not precise timing3.
- The practical takeaway: at extreme fear, start scaling in gradually — don't go all-in; at extreme greed, tighten stops and take profits in tranches; always read it alongside the liquidation heatmap, open interest, and price trend, never in isolation.
Here's the whole thing from the top.
Table of Contents
- What is the Fear and Greed Index? A Sentiment Thermometer
- How Is It Calculated? The 6 Weighted Factors
- How to Read It: The Five Zones and the Contrarian Approach
- How to Combine It with Other Indicators: A Reusable Framework
- 4 Counterintuitive Truths Every Beginner Should Know
- 3 Common Mistakes to Avoid
- Frequently Asked Questions
- Further Reading
What is the Fear and Greed Index? A Sentiment Thermometer
Before you look at any number, understand what it's actually measuring. The Fear and Greed Index does one thing: it converts "how panicked or euphoric the market is right now" into a number from 0 to 100.
The idea comes from traditional markets — CNN Money built an original "fear and greed index" to track stock-market sentiment. The crypto version was launched by Alternative.me around 2018, porting the same logic to crypto and updating it once a day1.
A 0–100 thermometer
- 0 = Extreme Fear: the market is in full panic, everyone is dumping.
- 100 = Extreme Greed: the market is euphoric, everyone is screaming "get in before it's too late."
- ~50 = Neutral: sentiment is flat, bulls and bears are balanced.
Each band is a reading on this sentiment thermometer. The core assumption is that extreme emotion drives irrational decisions — fear makes people sell good assets cheap, greed makes people overpay for stretched assets. So extreme readings can actually point toward "opportunity" or "risk."
Why it's worth watching
Because crypto is one of the most emotionally extreme markets in the world. With no single fundamental "anchor," short-term price moves are driven heavily by sentiment. The Fear and Greed Index turns that invisible emotion into a dashboard you can glance at every day.
How Is It Calculated? The 6 Weighted Factors
The Fear and Greed Index isn't a made-up number — it's the weighted blend of 6 factors. Each factor gets scored separately, then the scores are combined by weight into a final 0–100 value1.
| Factor | Weight | What It Measures | When It Reads "Fear" |
|---|---|---|---|
| Volatility | 25% | Bitcoin's current volatility and max drawdown vs. 30/90-day averages | Abnormal crashes, volatility spikes |
| Market Momentum / Volume | 25% | Current trading volume and momentum vs. 30/90-day averages | Heavy selling, vanishing bids |
| Social Media | 15% | Engagement and tone of Bitcoin talk on X / Reddit | Panic posts flooding, negative tone |
| Surveys | 15% (currently paused) | Weekly polls of trader outlook | Majority bearish |
| Bitcoin Dominance | 10% | BTC's share of total crypto market cap | Rising dominance (capital fleeing to BTC) |
| Google Trends | 10% | Bitcoin-related search volume and wording | "How to sell Bitcoin" / "crash" surging |
Three things you must remember
The "Surveys" factor is currently paused. Alternative.me used to poll 2,000–3,000 traders weekly as one input, but this component is on pause. When it's inactive, its 15% weight is redistributed proportionally across the remaining active factors1. In practice, that means volatility, momentum, social media, Bitcoin dominance, and Google Trends are doing most of the work today.
Half the weight is "price-derived." Volatility (25%) + momentum (25%) = 50%. Both essentially describe "what Bitcoin's price and volume did recently" rather than independent "sentiment." That means half the index is restating recent price action — price just crashed, so the index is naturally low. It also explains why the index has high same-day accuracy but poor next-day predictive power3.
Bitcoin dominance is counterintuitive. First-time readers are often puzzled: why does rising BTC dominance count as "fear"? The logic — when the market panics, money rotates out of riskier altcoins into the "safest" BTC, pushing dominance up; when the market is greedy and risk appetite is high, money spills into altcoins and dominance falls. So rising dominance = flight to safety = fear; falling dominance = risk-on = greed1.
How to Read It: The Five Zones and the Contrarian Approach
Once you understand how it's calculated, the question is how to use it. The standard approach is contrarian — the more extreme the emotion, the more you should think the other way. This traces back to Buffett's famous line: "be fearful when others are greedy, and greedy when others are fearful"2.
| Index Range | Sentiment | Market State | Contrarian Read |
|---|---|---|---|
| 0–24 | Extreme Fear | Panic selling, blood in the streets | Higher odds of a local bottom; start scaling into quality assets |
| 25–49 | Fear | Nervous, grinding down | Accumulate slowly if your own research supports it |
| ~50 | Neutral | Directionless, wait-and-see | Be patient, wait for direction |
| 51–74 | Greed | Warming up, chasing | Turn cautious; consider taking profits, tighten stops |
| 75–100 | Extreme Greed | Euphoria, everyone screaming buy | Risk building; take profits in tranches, cut leverage |
Why "extreme fear" is often treated as an opportunity
The most extreme readings in history have often, in hindsight, marked good buying points. The classic case is March 2020 — the pandemic triggered a global asset crash, Bitcoin fell more than 50% in a matter of days, and the Fear and Greed Index dropped to single digits (a historic extreme). It felt hopeless at the time, but that zone turned out to be the launchpad for the 2021 bull market4.
The logic is simple: extreme fear means "most people who wanted to sell have already sold." Once panic selling exhausts itself, selling pressure fades at the margin, and with prices already beaten down, the risk/reward ratio improves.
But don't get the contrarian logic backwards
Contrarian strategy only applies at the extremes. The three middle zones (fear/neutral/greed) are of limited use — fear can keep getting more fearful, greed can keep getting more greedy. The only places worth acting on are the two ends: extreme fear below 25, and extreme greed above 75.
How to Combine It with Other Indicators: A Reusable Framework
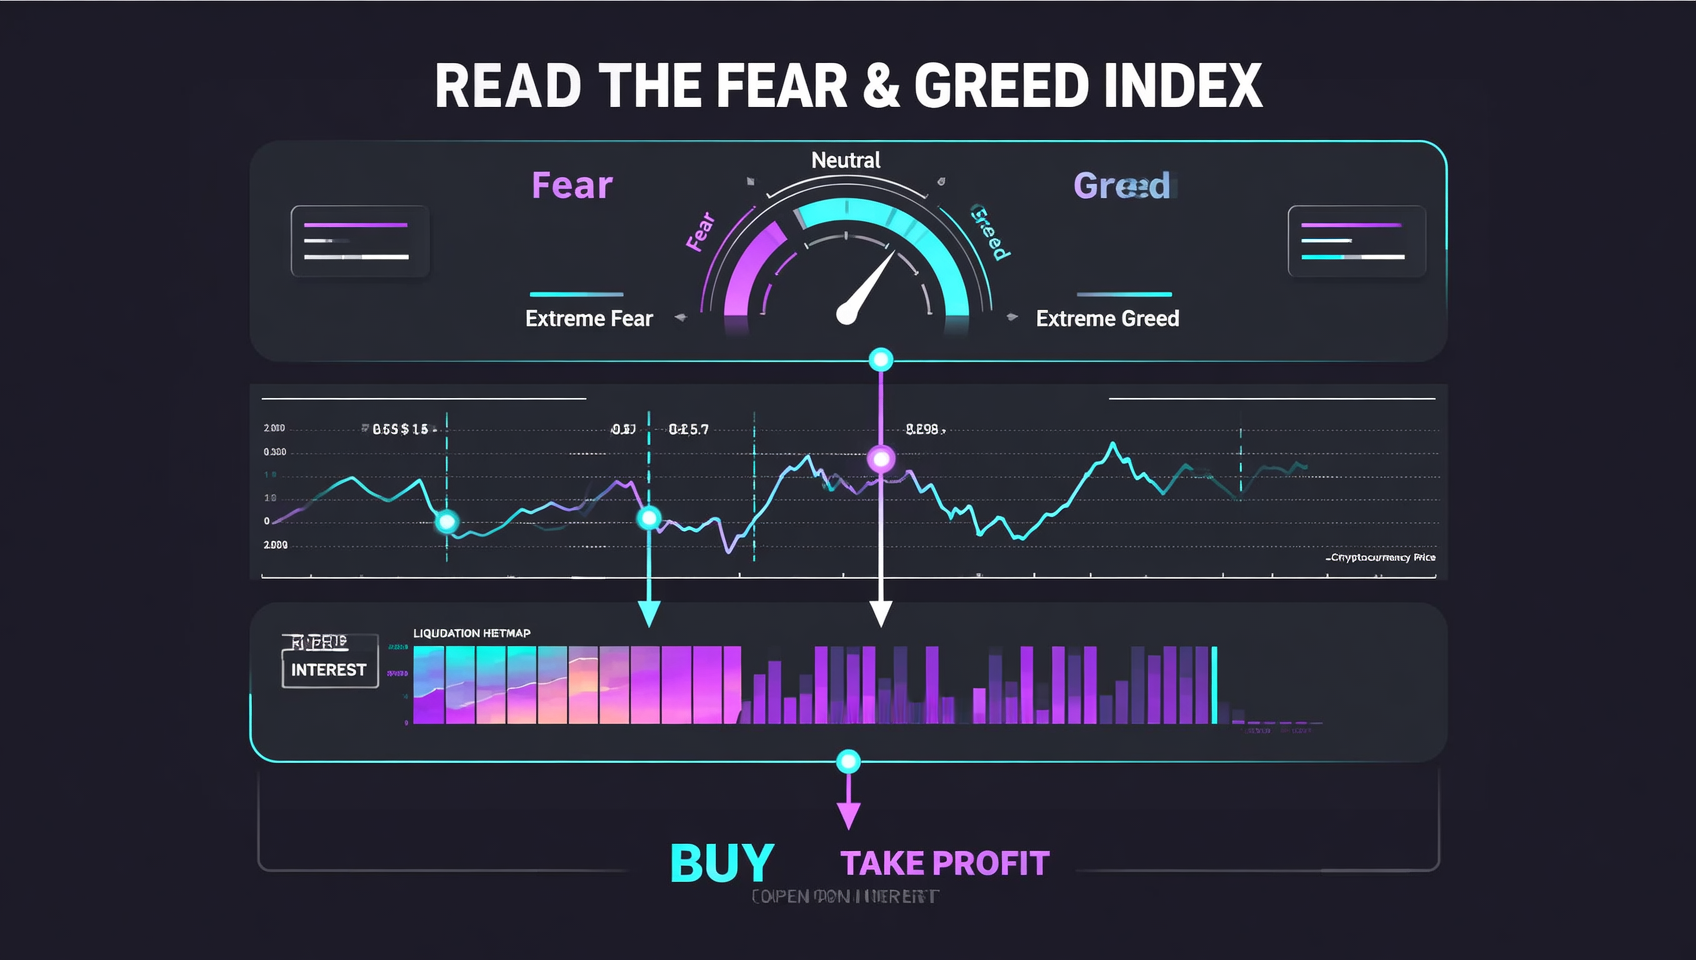
Reading the Fear and Greed Index alone can mislead you, because half of it is price-derived. The genuinely useful approach is to combine it with a few other indicators. The core logic: the Fear and Greed Index reads sentiment, price trend reads direction, and the liquidation heatmap plus open interest read leverage and trigger points.
| Combined Signal | What It Means | Lean |
|---|---|---|
| Extreme fear + price stabilizing | Panic released, selling exhausted | A good time to scale in gradually |
| Extreme fear + price still falling | Panic not over, don't catch a falling knife | Wait, don't rush the bottom |
| Extreme greed + price accelerating | Euphoric, late-stage move | Tighten stops, take profits in tranches |
| Extreme greed + high open interest | Leverage crowded, cascade risk | Cut leverage, brace for a sharp reversal |
| Neutral + price ranging | No clear direction | Stay patient, don't bet big on direction |
A decision flow:
- First check whether the index is at either extreme (<25 or >75) — if it isn't, don't read too much into it;
- Then look at price trend and position — when sentiment is extreme, is price "already stabilizing/stalling" or "still falling/rising on momentum";
- Add the liquidation heatmap and open interest to see whether leverage is also at an extreme (extreme greed + high leverage is the most dangerous combo);
- Then decide: extreme fear + stabilization → buy in tranches; extreme greed + high leverage → trim in tranches.
4 Counterintuitive Truths Every Beginner Should Know
It's a thermometer, not a weather forecast. A thermometer tells you how hot or cold it is right now, not whether it will rain tomorrow. Same here — the index describes current sentiment precisely but predicts future direction poorly. Use it as a forecast and you'll be disappointed3.
Extreme greed can last for months — don't rush to sell everything. In a late bull market, the index can sit in the 80+ extreme-greed zone for months while price keeps climbing. If you dump everything the moment you see "extreme greed," you'll likely sell into a melt-up and miss a big leg up. The right move is taking profits in tranches with a trailing stop and letting winners run with the trend.
Its next-day predictive power is near random. Research shows the index matches the market's same-day direction about 79% of the time, but predicts the next day only about 49% — roughly a coin flip. The reason: volatility + momentum carry 50% of the weight, so the index is largely restating "where price just went," and that doesn't tell you where it goes next3.
"Extreme fear" doesn't mean "the bottom is in." Fear can always get more fearful. Through the 2022 bear market, the index sat in fear — sometimes extreme fear — for long stretches while price kept grinding lower. Extreme fear is a "start paying attention" reminder, not an "all-in now" instruction — wait for actual stabilization signals before acting.
3 Common Mistakes to Avoid
Don't treat it as a precise buy/sell trigger. 0–24 extreme fear and 75–100 extreme greed are zones, not single-digit signals. A 22 today versus an 18 yesterday is not a meaningful change — don't flip your decision over a few points.
Don't hop between different versions of the number. Besides Alternative.me, CoinMarketCap and CoinGlass publish their own fear and greed indices with different methodologies and factor weights, so readings can diverge on the same day. Pick one source and stick with it rather than cherry-picking across versions1.
Don't use it for altcoins. The Fear and Greed Index — especially the Alternative.me version — is heavily Bitcoin-centric; volatility, momentum, Bitcoin dominance, and Google Trends all look directly at BTC. Altcoins can trade on their own independent patterns, so using BTC sentiment to time altcoin trades often leads you the wrong way.
Frequently Asked Questions
What is the crypto Fear and Greed Index? Where do I see it?
The Fear and Greed Index quantifies market sentiment on a 0–100 scale, where 0 is extreme fear and 100 is extreme greed. It's published daily by Alternative.me. The most common entry point is the Alternative.me website; CoinMarketCap and CoinGlass offer their own versions too.
How is the Fear and Greed Index calculated? What are the 6 factors?
It blends 6 weighted factors: volatility (25%), market momentum/volume (25%), social media (15%), surveys (15%, currently paused), Bitcoin dominance (10%), and Google Trends (10%). When surveys are paused, their 15% weight is redistributed proportionally to the remaining factors.
What counts as extreme fear vs. extreme greed?
The standard five zones: 0–24 extreme fear, 25–49 fear, ~50 neutral, 51–74 greed, 75–100 extreme greed. Most people only think contrarian at the two ends (below 25 and above 75).
Does a low Fear and Greed Index mean it's time to buy?
No. A low score means sentiment is panicked, not that price has bottomed. It can sit in fear for long stretches, and price can keep falling after extreme fear. Treat it as a "sentiment is extreme, start paying attention" reminder, and pair it with other indicators and gradual position-building.
Does a high Fear and Greed Index mean it's time to sell?
Not necessarily — blindly exiting often sells too early. In bull markets the index can sit at 80+ for months while price keeps rising. The safer move is to get more cautious, tighten stops, and take profits in tranches once it enters extreme greed, rather than selling everything at once.
Can the Fear and Greed Index predict price? How accurate is it?
Basically no. It describes current sentiment, not future direction. Research shows about 79% same-day agreement but only about 49% next-day accuracy (near random). Use it to judge whether sentiment is extreme, not to time entries precisely.
Further Reading
- Liquidation Heatmap Explained: BTC Liquidations, Open Interest & Funding Rate — the leverage/liquidation view that pairs best with the Fear and Greed Index
- Crypto Price Dropped — Now What? Stop Loss or Hold On — what to do when sentiment turns to panic
- Spot vs. Futures Trading: What Should Beginners Start With — if you haven't sorted out spot vs. futures yet
- Binance Funding Rate Explained — another crowding indicator to read alongside sentiment
- What Is Bitcoin? A Beginner's Guide — understand Bitcoin itself before reading the emotion around it
- On-chain guide — more blockchain fundamentals and on-chain tutorials
Data verification note: The Fear and Greed Index's definition, 6 factor weights, five zones, the "surveys paused" mechanism, and the March 2020 historic extreme were verified on 2026-10-15; see footnotes124. The "~79% same-day / ~49% next-day" figures come from a backtest study, see footnote3. The index is real-time data — check Alternative.me or your platform for the current reading.
This article is for educational purposes only and does not constitute investment advice. Cryptocurrency prices are highly volatile; the Fear and Greed Index and other sentiment indicators are references, not buy/sell signals. Make your own judgments based on your risk tolerance and comply with local laws and regulations.
Footnotes
-
Fear and Greed Index mechanics and calculation: launched by Alternative.me, inspired by CNN Money's stock-market Fear and Greed Index; 0–100 scale in five zones (0–24 extreme fear / 25–49 fear / ~50 neutral / 51–74 greed / 75–100 extreme greed), updated daily; six factors weighted — volatility 25%, market momentum/volume 25%, social media 15%, surveys 15% (currently paused, weight redistributed proportionally), Bitcoin dominance 10% (rising = flight to safety = fear), Google Trends 10%. Sources: Alternative.me (alternative.me/crypto/fear-and-greed-index), Binance Academy "What Is the Crypto Fear and Greed Index?", CoinMarketCap community article (queried 2026-10). ↩ ↩2 ↩3 ↩4 ↩5 ↩6 ↩7 ↩8
-
Contrarian usage and the Buffett principle: extreme emotion drives irrational decisions — fear makes people sell cheap, greed makes them overpay — so extreme readings often point to opposite opportunity/risk. Buffett's "be fearful when others are greedy, and greedy when others are fearful" is the intellectual source. Sources: CoinMarketCap community article, Cronos Learn, Ledger Academy (queried 2026-10). ↩ ↩2 ↩3
-
Predictive-power backtest data: research shows the index matches the market's same-day direction ~79% of the time but predicts the next day only ~49% (near random); the reason is volatility + momentum carry a combined 50% weight, essentially restating recent price. Source: backtest study cited in the CoinMarketCap community article (queried 2026-10). ↩ ↩2 ↩3 ↩4 ↩5
-
March 2020 historic extreme: the pandemic triggered a global asset crash, Bitcoin fell more than 50% within days, and the Fear and Greed Index dropped to single digits (a historic extreme) — a zone that later became the launchpad for the 2021 bull market. Source: retrospectives of the March 2020 crash by multiple exchanges and media (queried 2026-10). ↩ ↩2